

Volatility trading and DDE
Hey there, Protraders!
In one of the previous articles "The options in Protrader: volatility, direction and time" we’ve considered the basic components of the option trading. Along with the directional trading and usage of options’ time break-up, the topic of volatility trading was touched. The trader who trades volatility, counts on the changing nature of the underlier motion and the corresponding reassessment of the option costs. If a trader possesses a long position in volatility, then he assesses the present volatility as low and expects for its growth. When opening a short position in volatility, a trader take up the present volatility as high and predicts its fall. In both cases, try to minimize the influence of the underlier value and the time break-up. There are many option strategies that trade volatility. In this article we’ll consider in detail one of the simplest strategies of the volatility trading – buying of the volatility by means of synthetic straddle.
Before we move directly to the description of the strategy, we should focus on a few concepts that will help to understand the essence of the proposed strategy.
Delta-neutrality. As we have noted previously, the traders who trade volatility often try to minimize the influence of the underlier motion on the option policy value. To put it differently, they seek to ensure that the profit and loss strategies, if possible, depend only on the change in volatility. As we already know, greek “Delta” is responsible for the option sensitivity to the change of the underlier value. If “Delta” of the composed option policy or securities portfolio is equal to one, then for small movements of the underlier, considered strategy will behave as a position composed of unit of the underlier. If “Delta” is equal to zero, then strategy is considered neutral by “Delta”. To put it differently, the underlier motion doesn’t lead to the cost change of the considered option policy or securities portfolio. The neutrality of the strategy by the “Delta” is reached by opening the positions that are opposite by direction or by hedging.
Exposition. The exposition - is an equivalent of the option position in the underlier. It is defined as the total delta of the selected option policy. The concept of the exposition is applied for better understanding of behavior of the selected option policy depending on the underlier motion. If exposition is equal to zero, then considered strategy is a delta-inert.
Buying of the volatility by means of position composed of synthetic straddle
Buying of the volatility is justified in the case, when trader expects the growth in volatility of the underlier. The simplest example of the long volatility trading is a buying of the synthetic straddle with constant support of delta-neutrality. If strategy is a delta-inert, then change of its cost will only occur under the influence of changes in volatility and time value of the options. We know that volatility is the most strongly affects the options "at the money", so namely these options will be used in the trading.
For understanding the strengths and weaknesses of the chosen strategy, let’s remember the classic long straddle. It is created by package call and put options using the same strike price of one option series. In this situation, the profile of the position looks as follows:
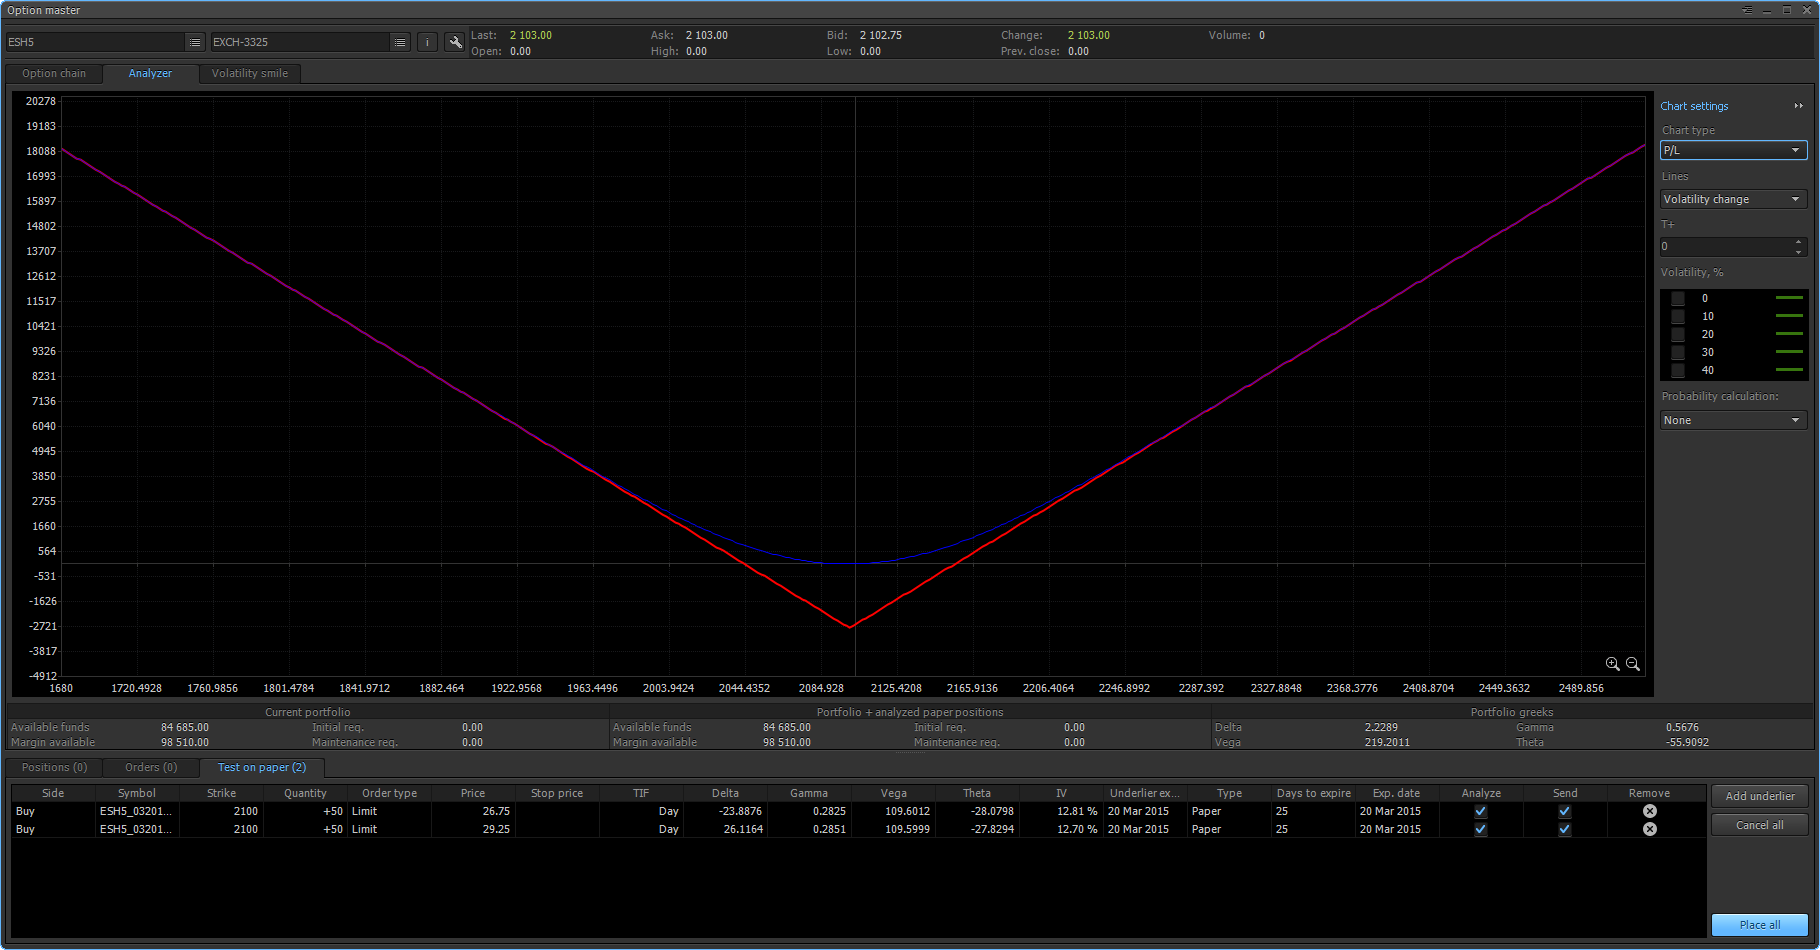
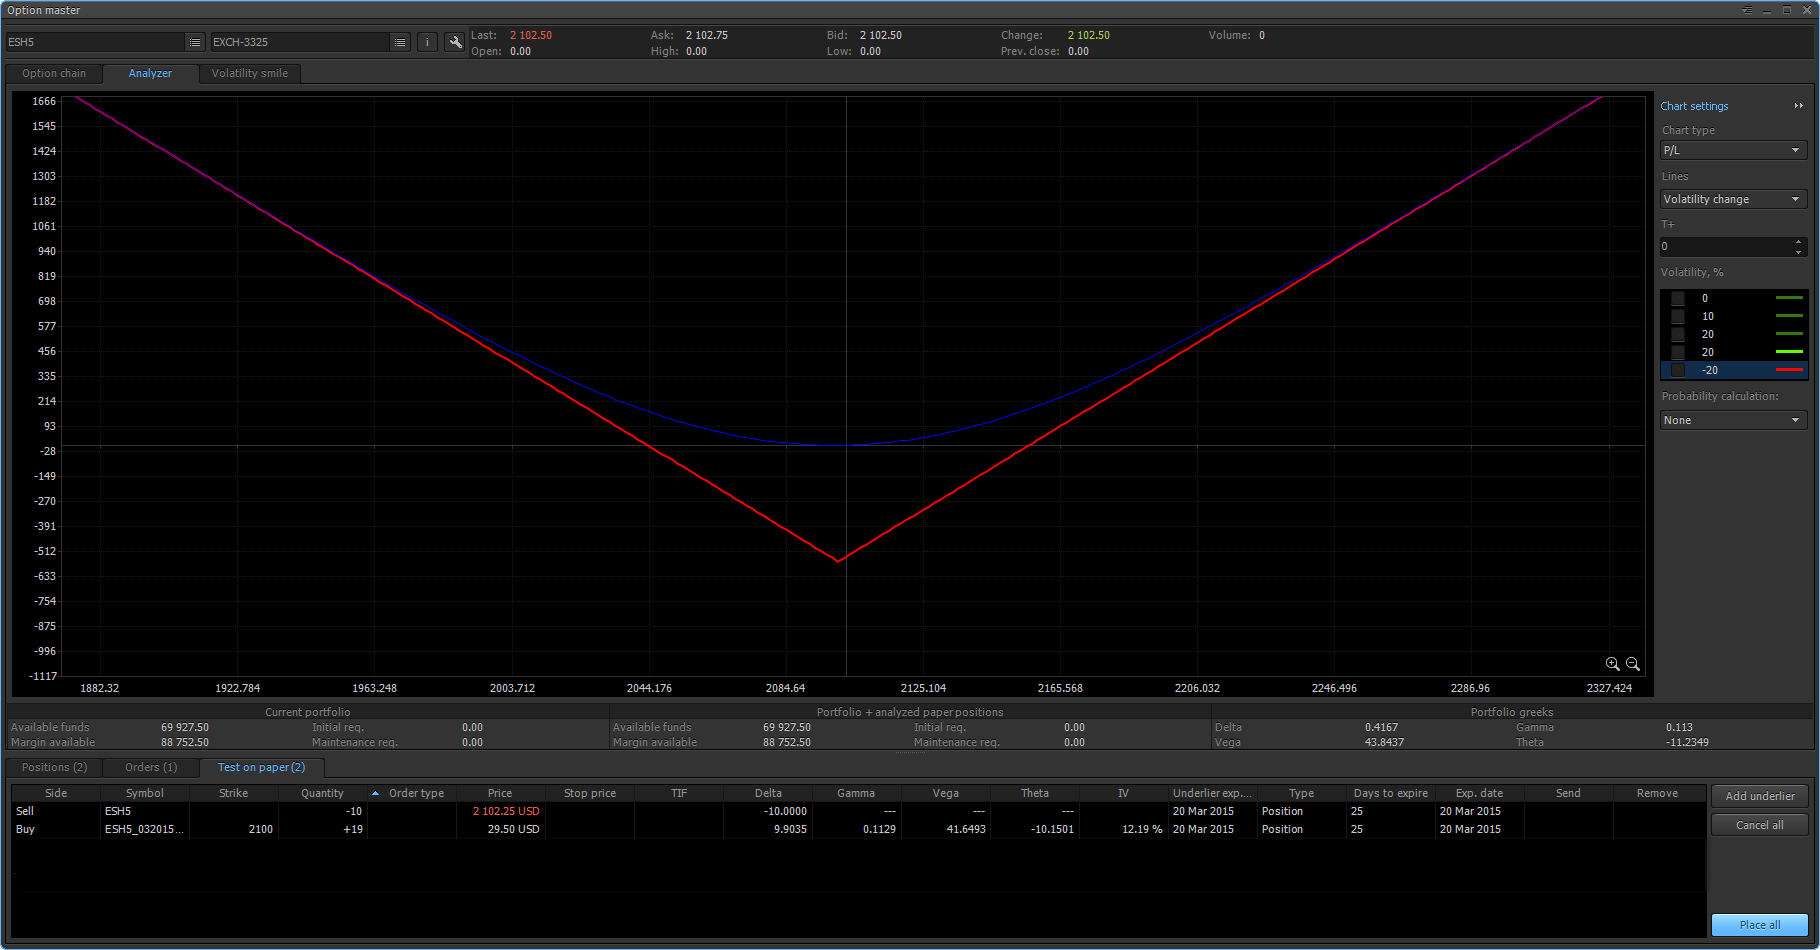
Put and Call options on March futures contract of index mini S&P 500 with strike price 2100 were used for the creation of this option policy. The chosen strategy is not strictly delta-inert. Significant movement of the underlier, both up and down will lead in a profit. If the underlier moves in a narrow corridor, the strategy will yield losses due to the time break-up action of the options’ value. Below let’s consider the profile of the strategy taking into account the time break-up:
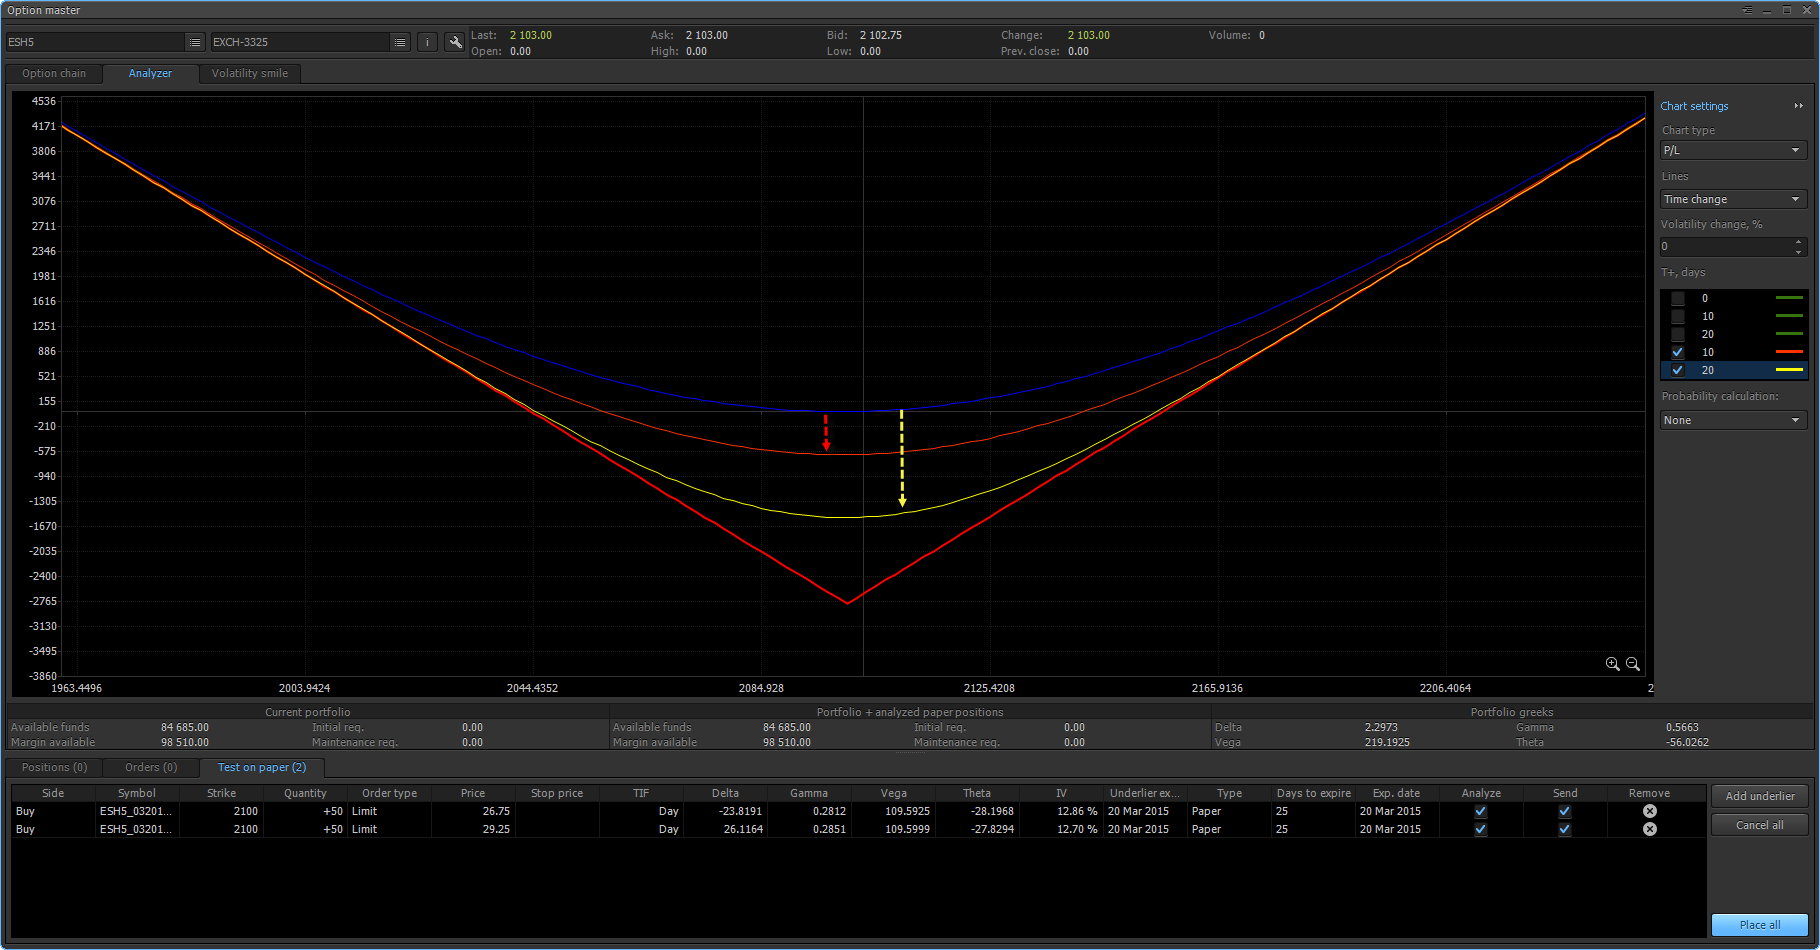
Profiles of the position considering the time break-up for 10 (red) and 20 (yellow) days are shown on the screen. In this situation the growth of the implied volatility will lead in a profit, and its fall – to the losses. Profile of the position considering the growth (green) and downfall (red) of the implied volatility on 20% is shown on the screen below.
Straddle can be created a different way using the underlier. Such straddle is called synthetic. In our case, it will consist of the purchase of Call options “at the money” and their hedging using sale of the corresponding underlier quantity.
Let’s buy 19 Call options with strike price 2100 and term till expiration of 25 working days. In this situation, the underlier value is on the level of 2102,5 points.
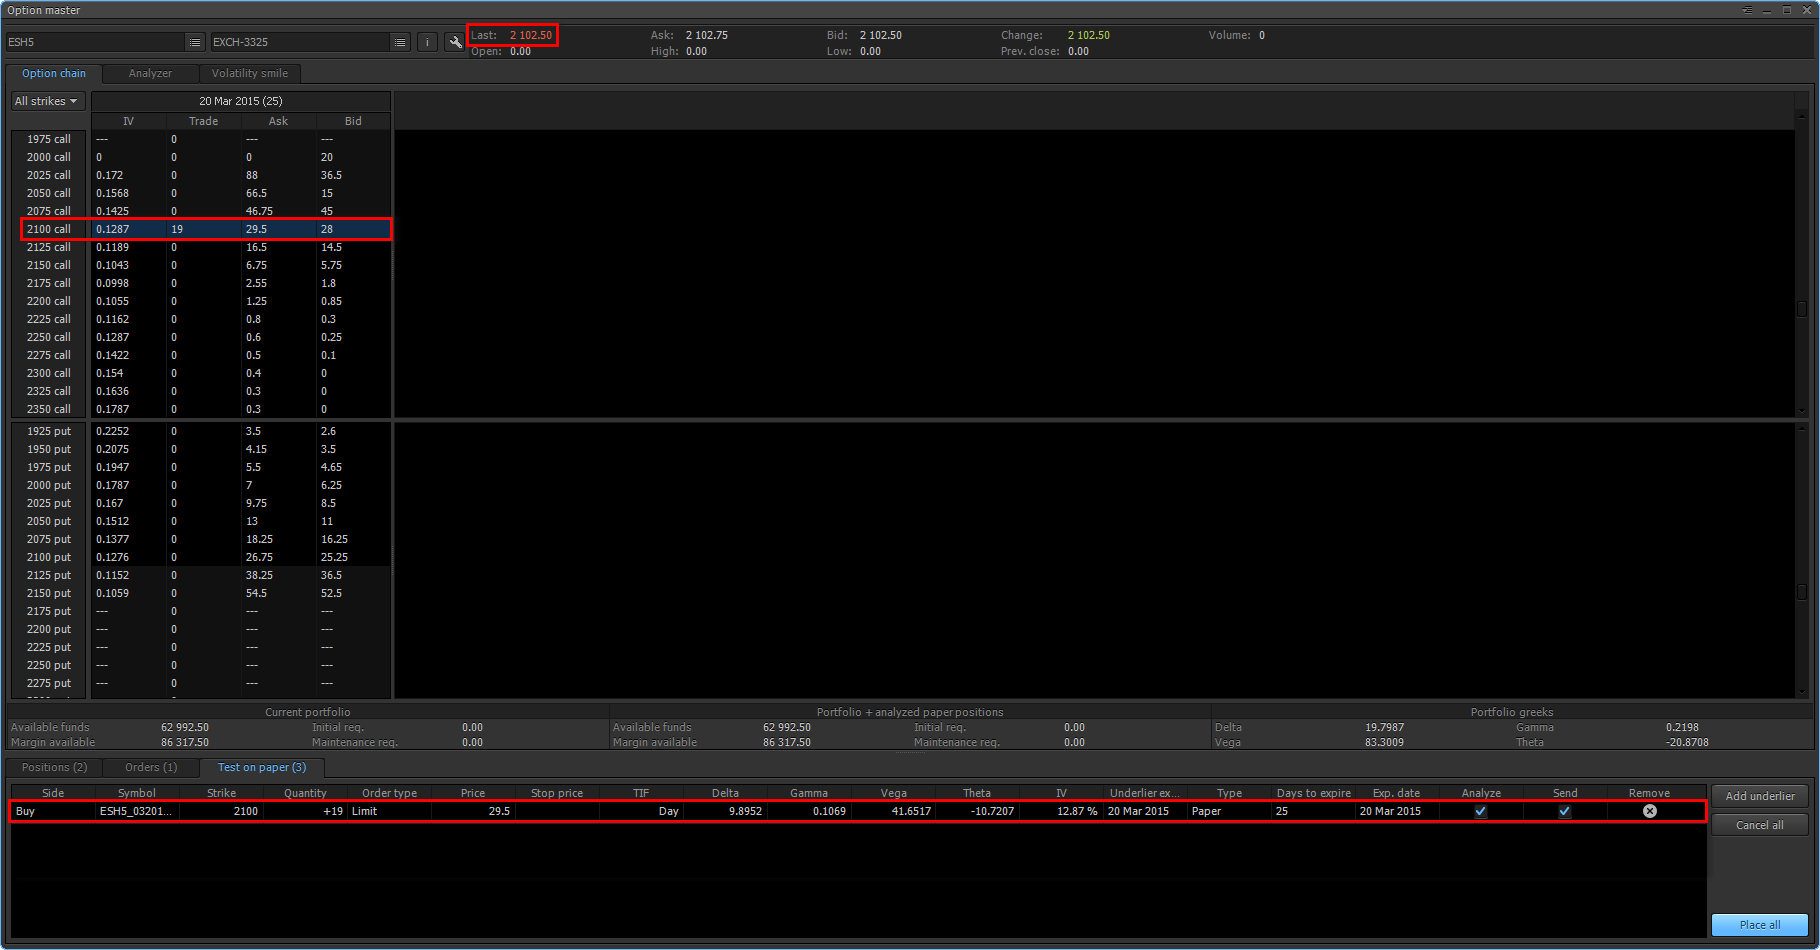
Total “Delta” of the position or its exposition by the underlier is 9.9. To put it differently, with a slight underlier motion, this strategy will conduct oneself similarly to the purchase of 9.9 contracts of the underlier. To protect against possible losses when moving the underlier, let’s perform hedging of this risk by selling 10 futures contracts.
Now the total exposition of this strategy is 9.9 - 10 = -0.1, which suggests that with small movements of the underlier, the strategy will be equivalent to the sale of 0.1 standard contract of the underlier. Note, that this strategy is also not fully delta-inert, for more exact hedging of the position, we need to increase the amount of long options and the corresponding amount of futures contracts. The greater the amount of contracts, the better will be the process of re-hedging. Conditionally, it is possible to characterize the obtained position as a delta-inert, since the greater accuracy is not available to us due to the limited capital. Note, that delta-neutrality of such construction will be saved only for small movements of the underlier. With more significant changes in the price of the underlier, the total “Delta” of long Call options will be changed, this will lead in a loss of a delta-neutrality. To return to the state of the delta-neutrality, it is required additionally to sell or buy the corresponding amount of contracts of the underlier. This process is called re-hedging. Let’s consider the cases of the fall and growth of the underlier.
The growth in prices of the underlier
With the growth of the underlier value s, Call options will start to go over to the state "in the money" and their "Delta" will grow. At the expense of bending the price profile, the options will start to bring more profits than losses on the short futures contracts.

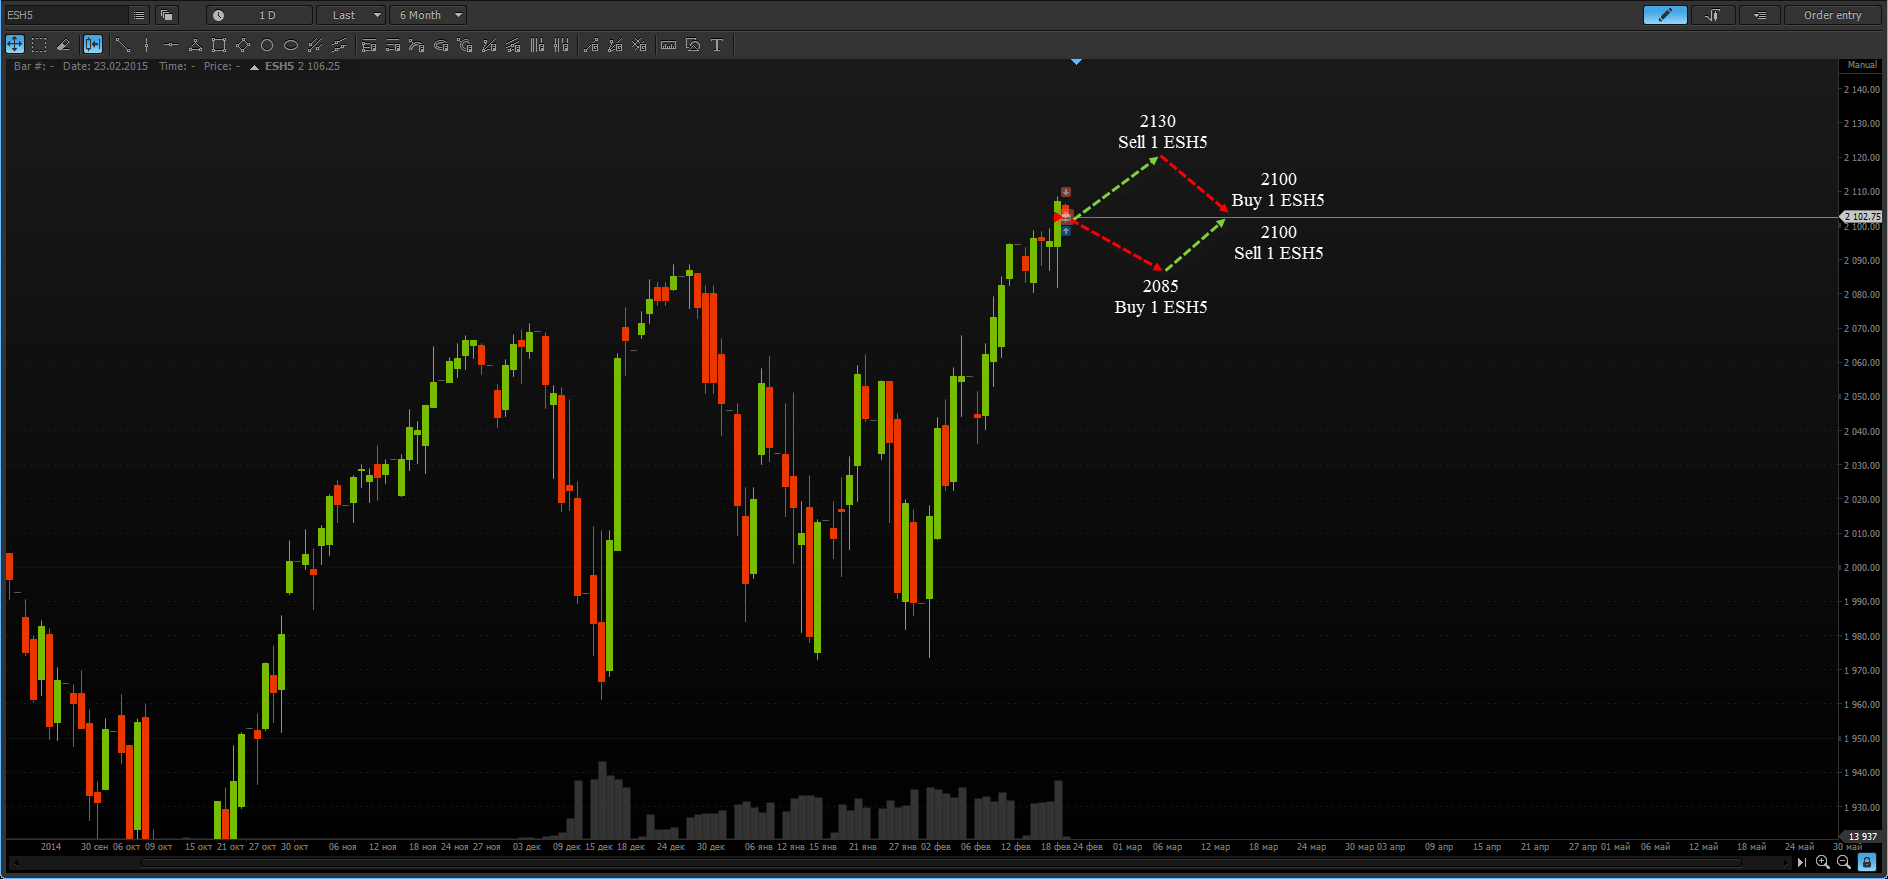
When opening the position, “Delta” of the options was 9.9, in the case of growth of the underlier value till 2115, “Delta” will reach the value 11. Since “Delta” of ten sold futures contracts has remained equal to -10, the total exposition of the strategy is equal 11-9.9 = 1.1. Summarily, the strategy will become too long. To bring it to the state of the delta-neutrality, we’ll need to sell one contract of the underlier. Now, if the underlier value will fall to the previous levels, “Delta” of the options will decrease. The strategy again stops to be a delta-inert. To return the position to the delta-inert state, we will need to buy up previously sold futures contract. Sold at high prices, bought at lower prices. This will bring a profit, and the strategy returns to the delta-inert state.
The downfall in prices of the underlier
With fall in the underlier value s, Call options will go over to the state “out of the money” and their “Delta” will decrease. At the expense of bending the price profile, the options will start to bring smaller loss than profit from sold futures.
When opening the position, “Delta” of the options was 9.9, in the case of fall of the underlier value till 2085, “Delta” will decrease to the value 9. Since “Delta” of ten sold futures contracts has remained unchanged, the total exposition of the strategy is equal 9-10 = -1. Summarily, the strategy will become too short. To return it to the state of the delta-neutrality, we’ll need to buy one contract of the underlier. Now, if the underlier value will grow to the previous levels, “Delta” of the options will increase. The strategy again stops to be a delta-inert. To return to the delta-inert state, we will need to sell previously bought futures contract. The purchase was made at lower price; the sale of this futures contract will be profitable. The strategy will be back in the delta-inert state.
Thus, in the case of volatile movement of the underlier to the both sides, the profit will be generated due to dynamic reduction of the position to the delta-inert state (re-hedging).
Due to the fact that "Delta" of the minimum possible position by the underlier is equal to one, then minimal possible step of re-hedging will be the rejection of the exposition of the entire strategy on unit in one direction or another.
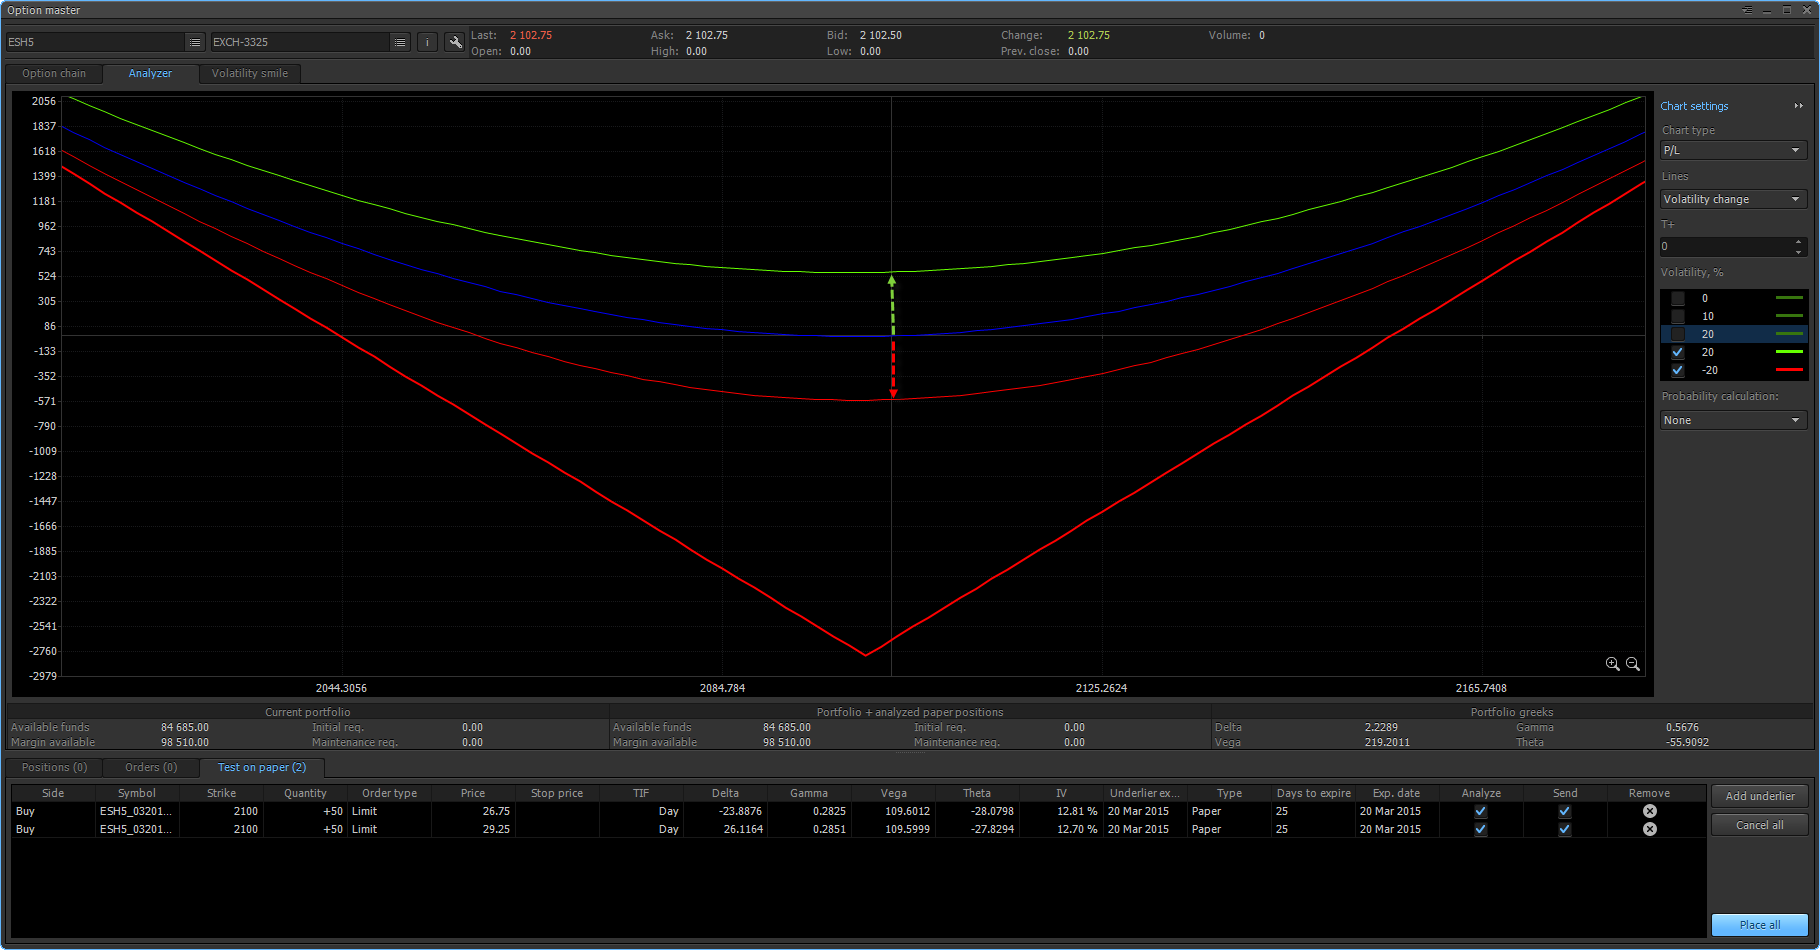
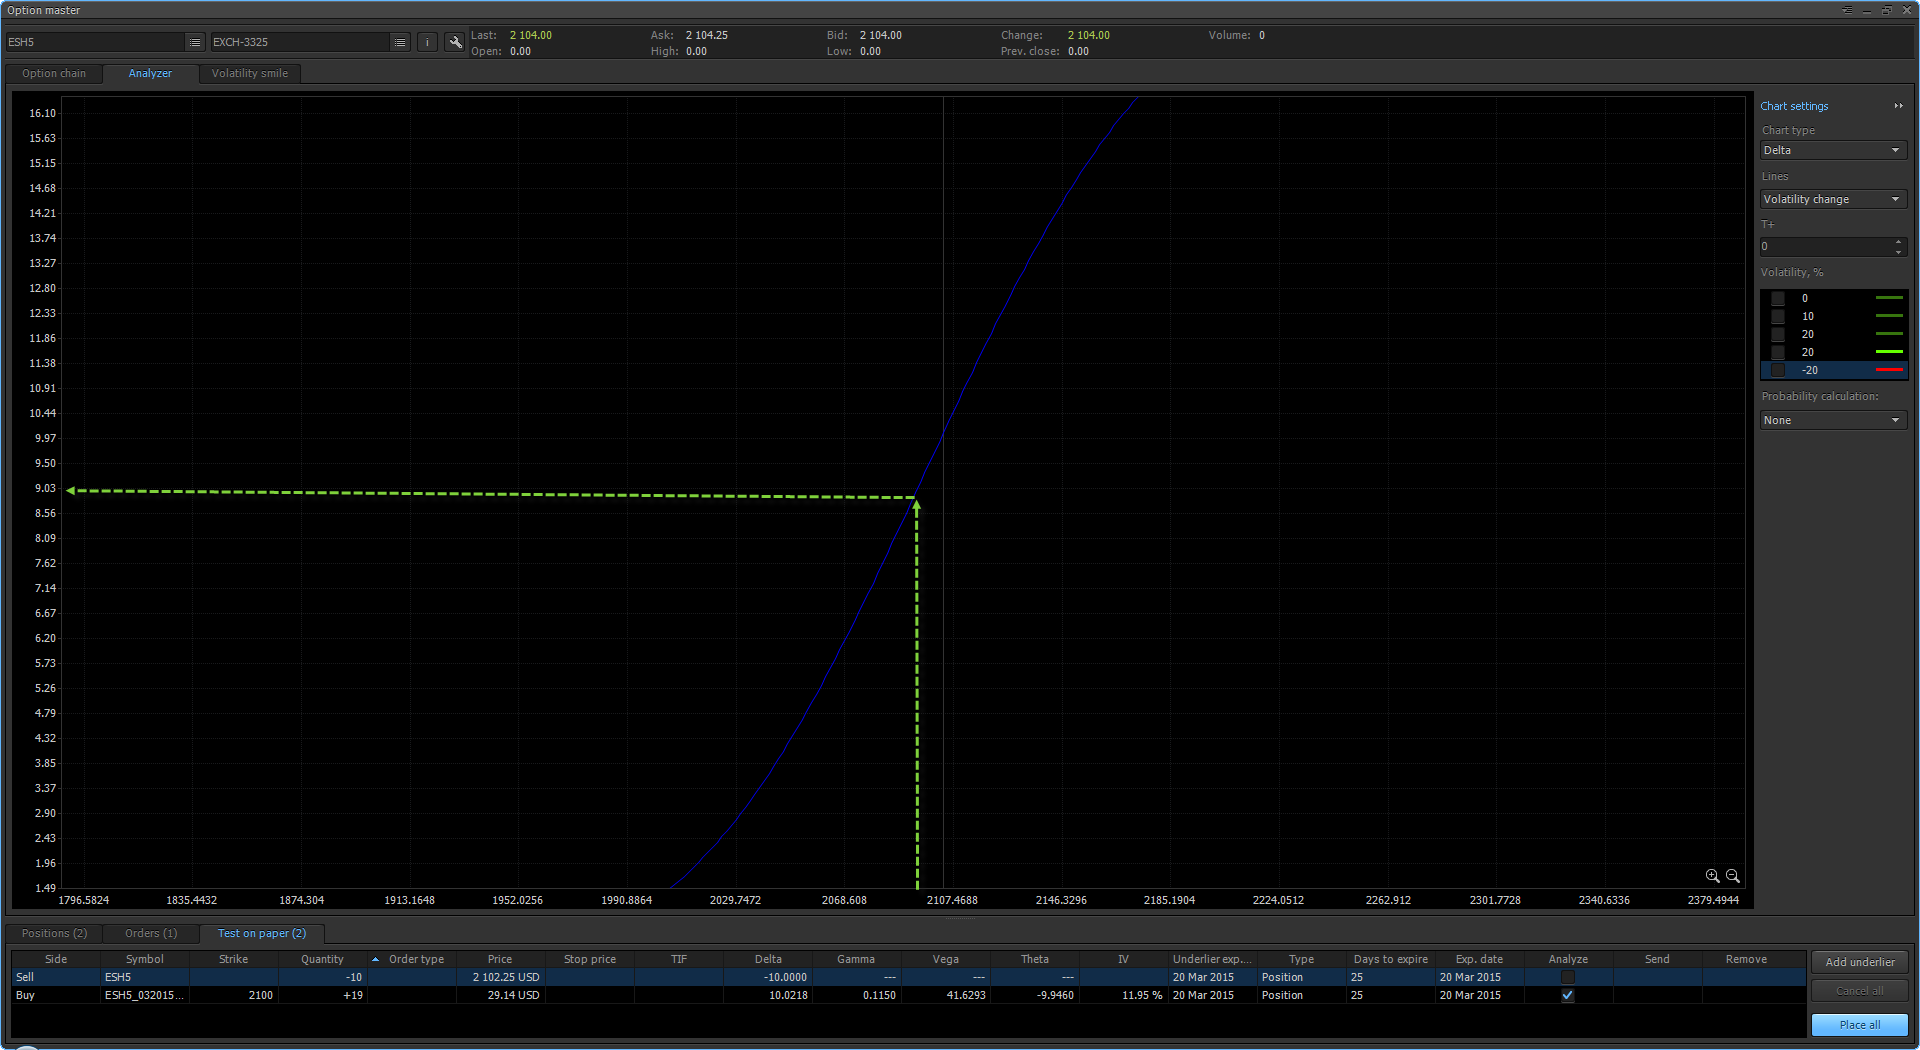
In the case of small movements of the underlier, the strategy remains a delta-inert, but can cause losses due to the time break-up or fall in the implied volatility. In the case of volatile "saw-shaped" movement, the considered strategy brings a profit due to the dynamic re-hedging and growth of the implied volatility. What will happen if the underlier for a long time will move in one direction without significant rollbacks? In this situation, when moving away from the state of "at the money", the speed of delta change of the options will decrease. Greek “Gamma” is responsible for this characteristic. The profile of “Gamma” for the considered strategy will look as follows:
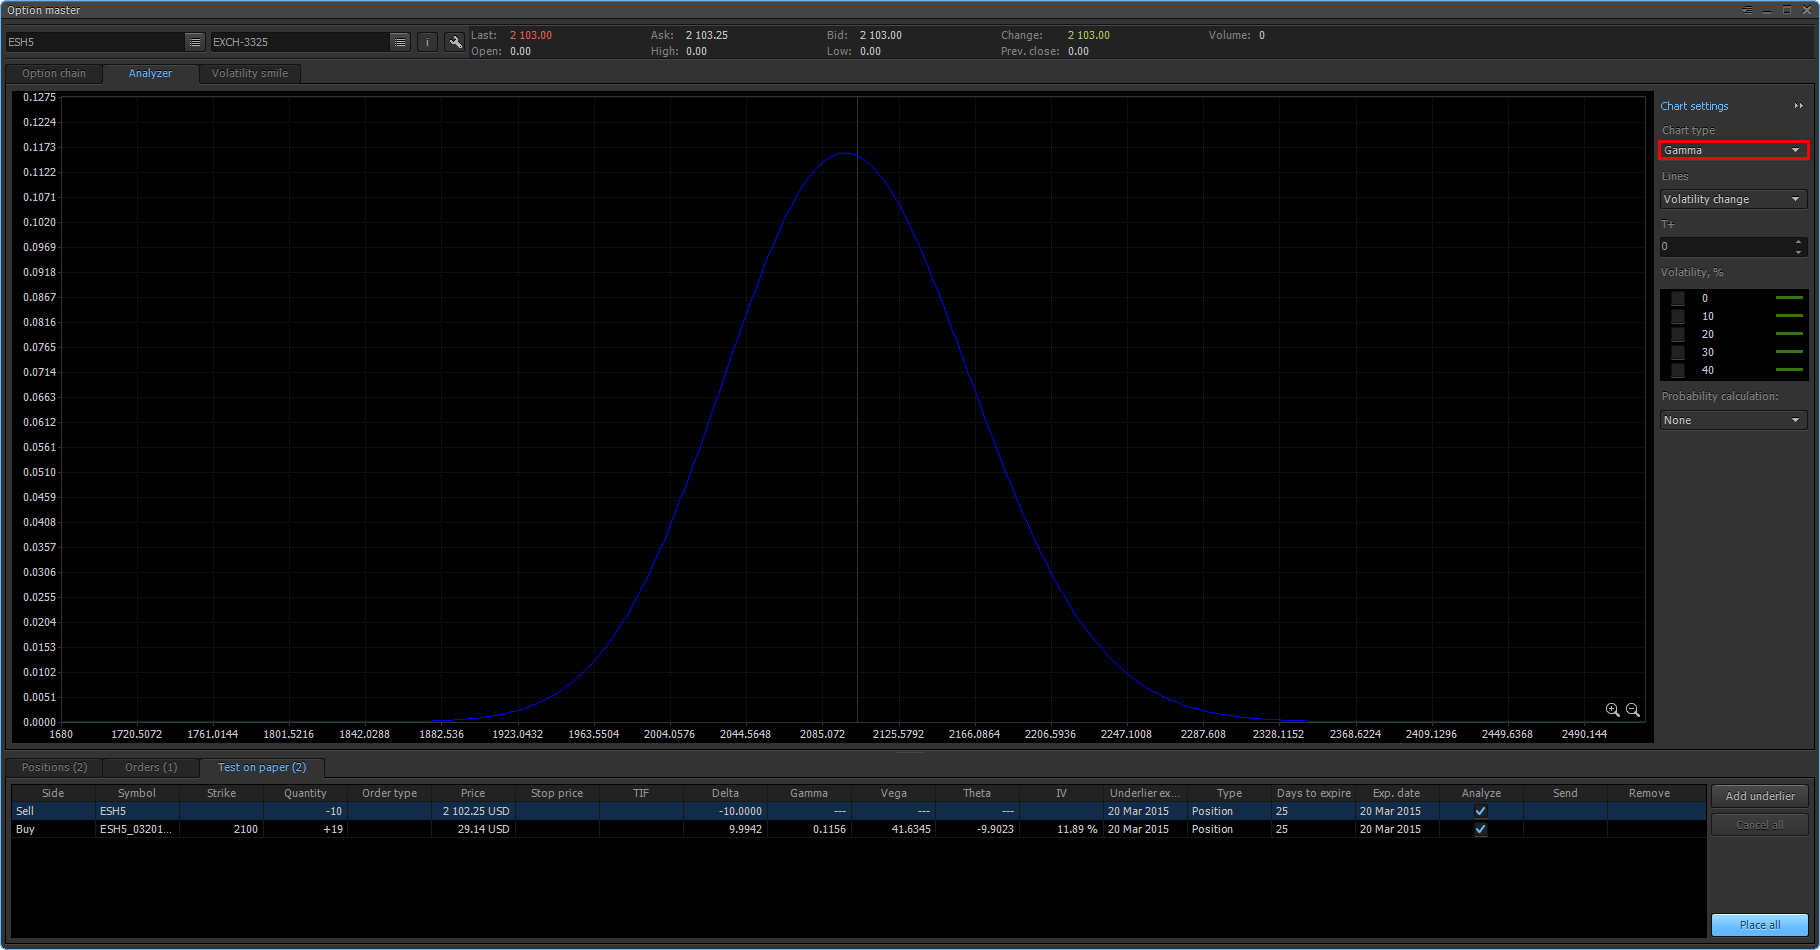
Note that far “out of the money” and far “in the money”, "Gamma" tends to zero. This suggests that after performing a certain amount of re-hedging in the course of the directional movement of an asset, we will reach a point where "Delta" of an option is not changed, and a strategy is delta-inert. In this situation, losses can only occur due to the time break-up of the options, or downfall of the implied volatility, that under the strong directional movement of the underlier is unlikely. The stronger the directional movement, the better, since according to the profile of the strategy, it will bring a substantial profit.
It can be concluded that the considered strategy will bring the greatest profit with the volatile "saw-shaped" price movement in the area of purchased strikes. Namely there, in the state “at the money”, “Gamma” has the greatest values, which leads to a rapid change of the “Delta” and frequent re-hedging. And as we have already noted, it is re-hedging generates a profit. On the other hand, we should carefully approach the choice of re-hedging step, since too frequent rebalancing of the strategy entails high costs in the form of commissions, which can negate all the profits. It is also worth finding a balance between long and short lifecycles of the options. On the one hand, the time break-up (“Theta”) plays against the long option policy, and we should try to minimize its impact. But on the other hand, the longer the duration before the expiration of the options, the less the “Gamma”. This leads to a rare re-hedging and low income, even at a relatively volatile market. This strategy has limited losses and unlimited profit potential. At the corresponding level of forecasting of the asset volatility, the considered strategy shows amazing results.
Often, when trading options, trader has to monitor some non-standard indicators. They may include total “greeks”, their derivatives and exposition of all positions or individual constructions in the portfolio. How not to miss the moment of re-hedging of separately taken buying of the volatility if several different strategies are traded simultaneously?
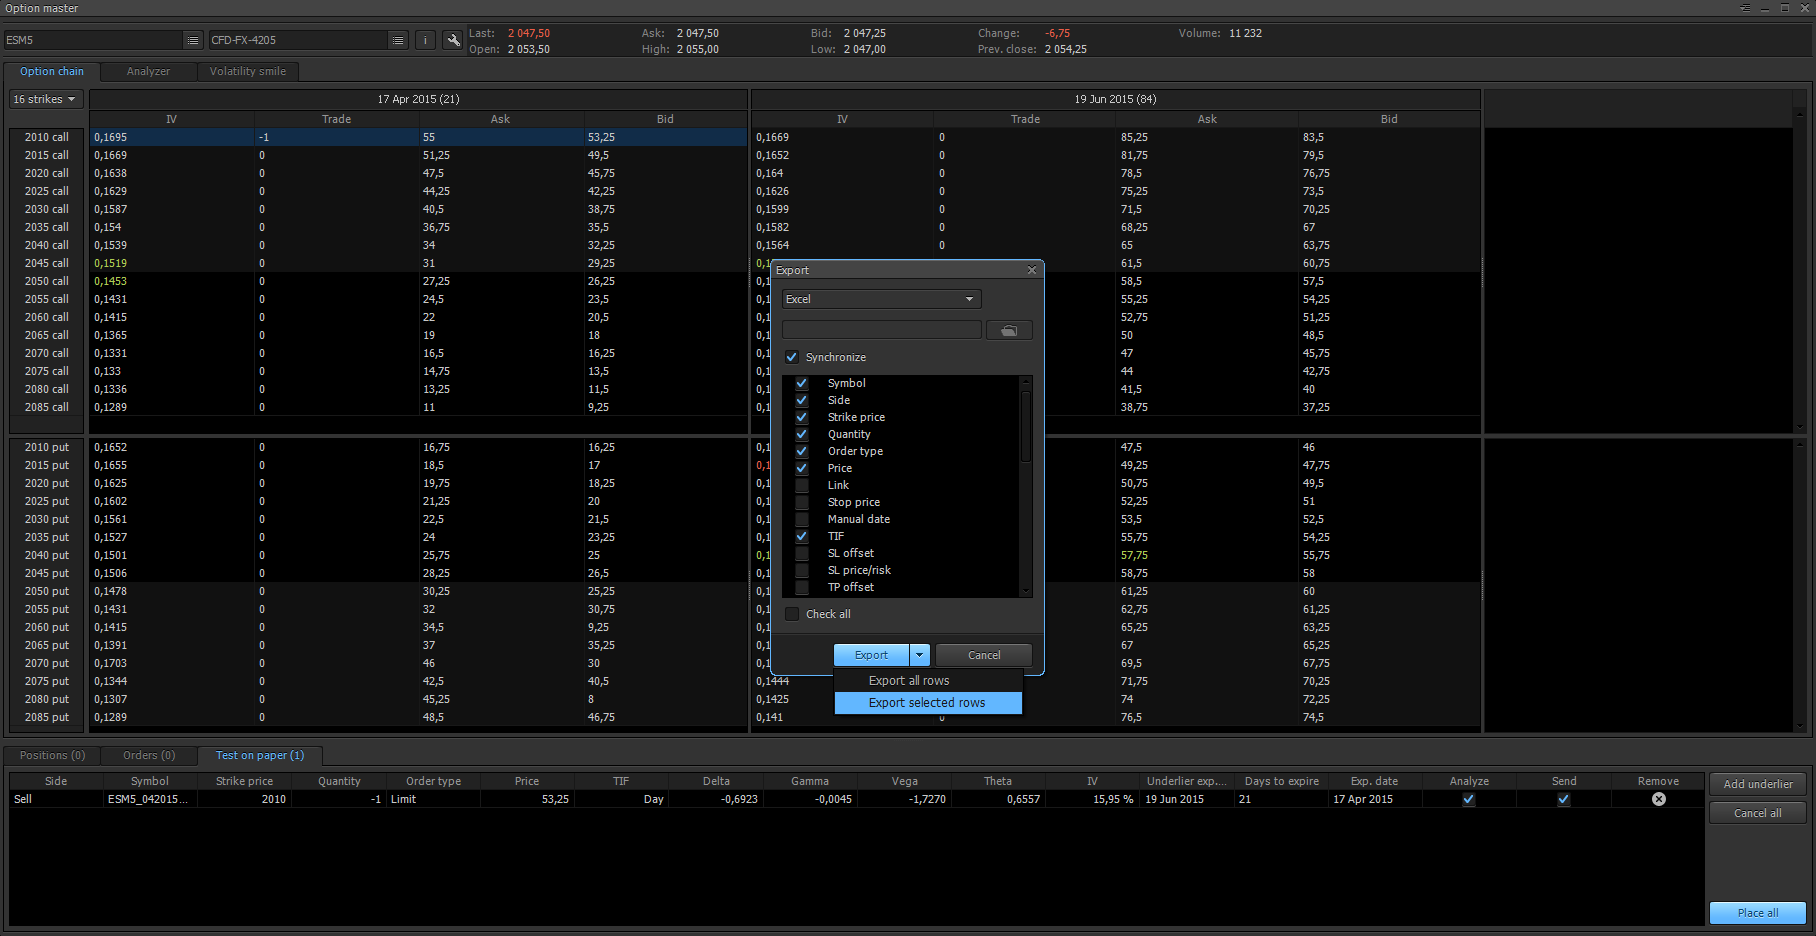
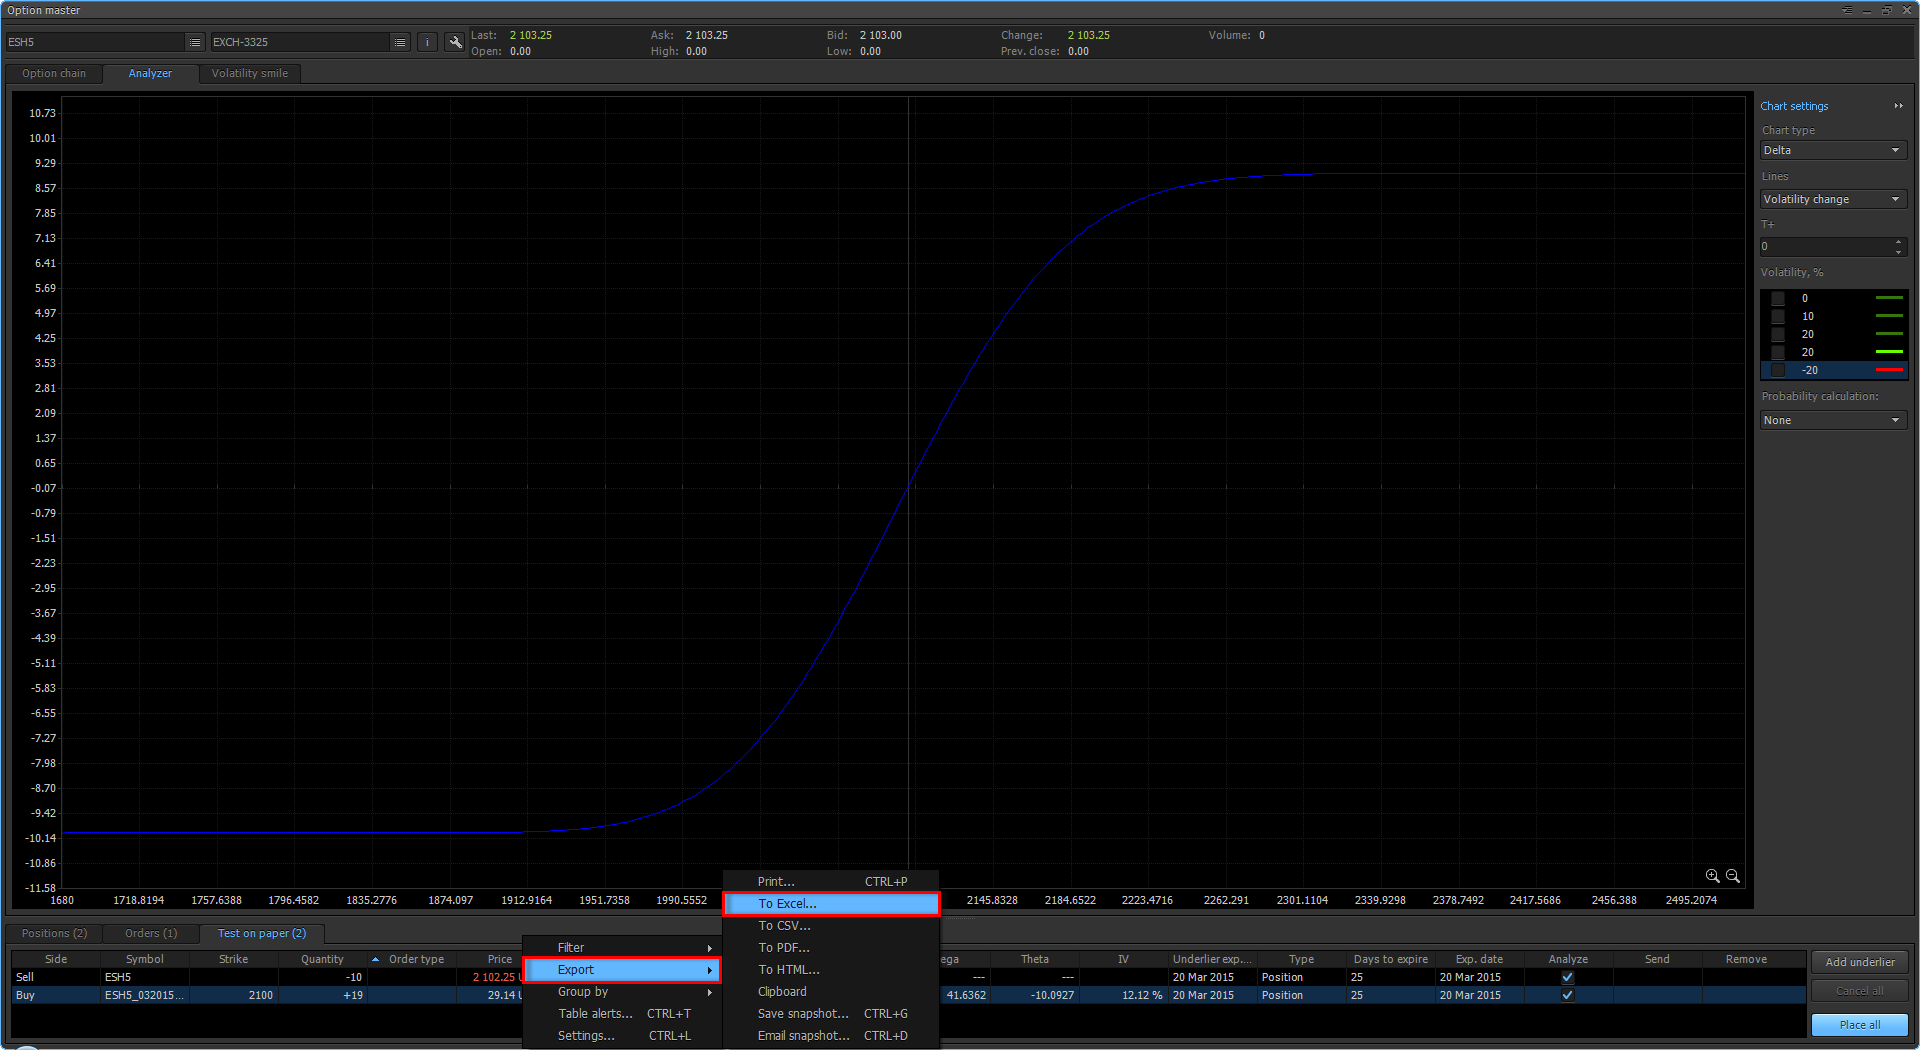
To keep track the total “greeks” of the chosen strategy, let’s use the data export with the help of DDE protocol. This will allow to dynamically track the moment of the position re-hedging and not to miss a profit. In practice, often, specific user calculations are necessary to be made with the help of specialized software, herewith using data from their trading terminal. As a simple example, let’s use the data export to the Excel spreadsheet.
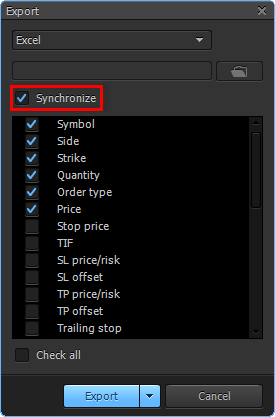
Choose the needed parameters and set data synchronization:
Then, calculate total “Delta” of the chosen strategy as a simple sum of “Deltas” of separate positions. Sum. Delta = F2 + F3.
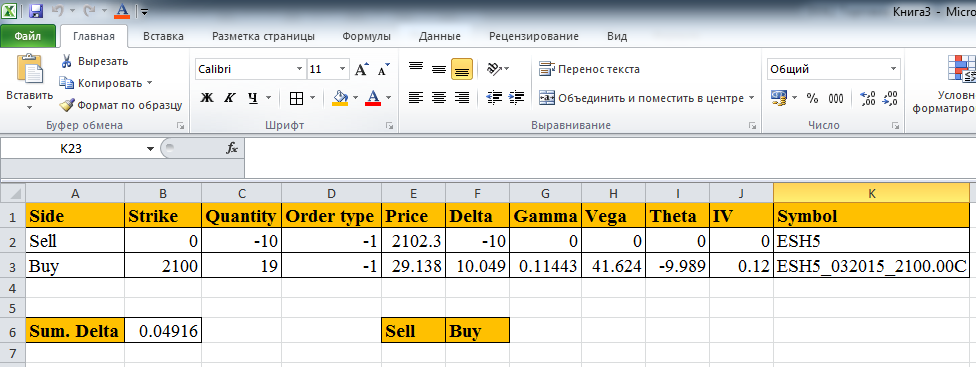
Format the cells B6 so that when exceeding the exposition of some specified value of the minimal re-hedging step, they will be painted in green and red colors for the purchase and sale of the underlier respectively. The amount of the underlier contracts which should be sold or bought, will be equal to the rounded quotient value of total "Delta" and "Delta" of the lowest possible position by the underlier.
Have not tried PTMC yet? There is no better way to boost knowledge than to use it! Start trading with PTMC now!

