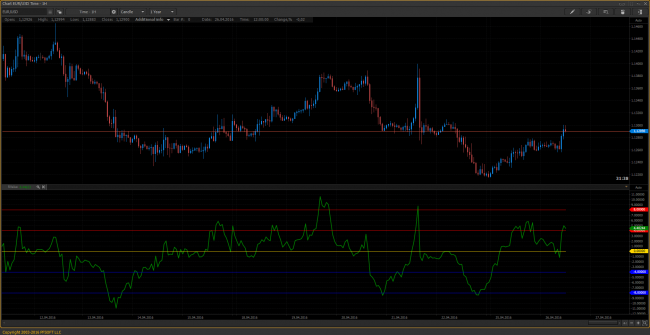
RValue Oscillator
Value Charts (Helweg and Stendahl, 2002) is an innovative charting technique that displays price in terms of value instead of cost even while price volatility changes over time. It shows when a particular market is at an extreme level and is likely to reverse.
