How to display 'histogram' indicator on the chart
Hi,
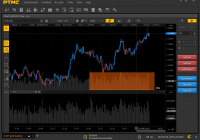
I would like some help/suggestions as to how I can get histogram values for a custom indicator to show on the bottom most point of a price chart i.e. the X axis.
Very much like the 'Volume bars' that are made visible via enabling the option to view them by right click--> Settings--> Volume bars.
The important point being that it sits at the bottom of the chart with correct scaling versus the historical volume bars.
I have attached a screen shot, the area highlighted by the rectangle is what I am looking to create by using values from a custom indicator.
Screen shot link - https://gyazo.com/e236b592d7f44933e1d7f590dcde1cef
Thankyou
Replies
Hi, ssk1284u!
Follow this link https://dotnetfiddle.net/QYWcqH. It's a code of indicator that does same as "Volume bars" (displays Volume values) option but fully customizable:
Follow this link https://dotnetfiddle.net/QYWcqH. It's a code of indicator that does same as "Volume bars" (displays Volume values) option but fully customizable:
To use some specific value just place into OnQuote() method your calculated value instead of current one:
        public override void OnQuote()
        {
            double calcValue = 0;

            // some calculations block ...

            DateTime timeKey = CurrentData.Time();
            values[timeKey] = calcValue;
        }
Good Luck!
Join PTMC community to post your replies on forum


