MultiTimeframe
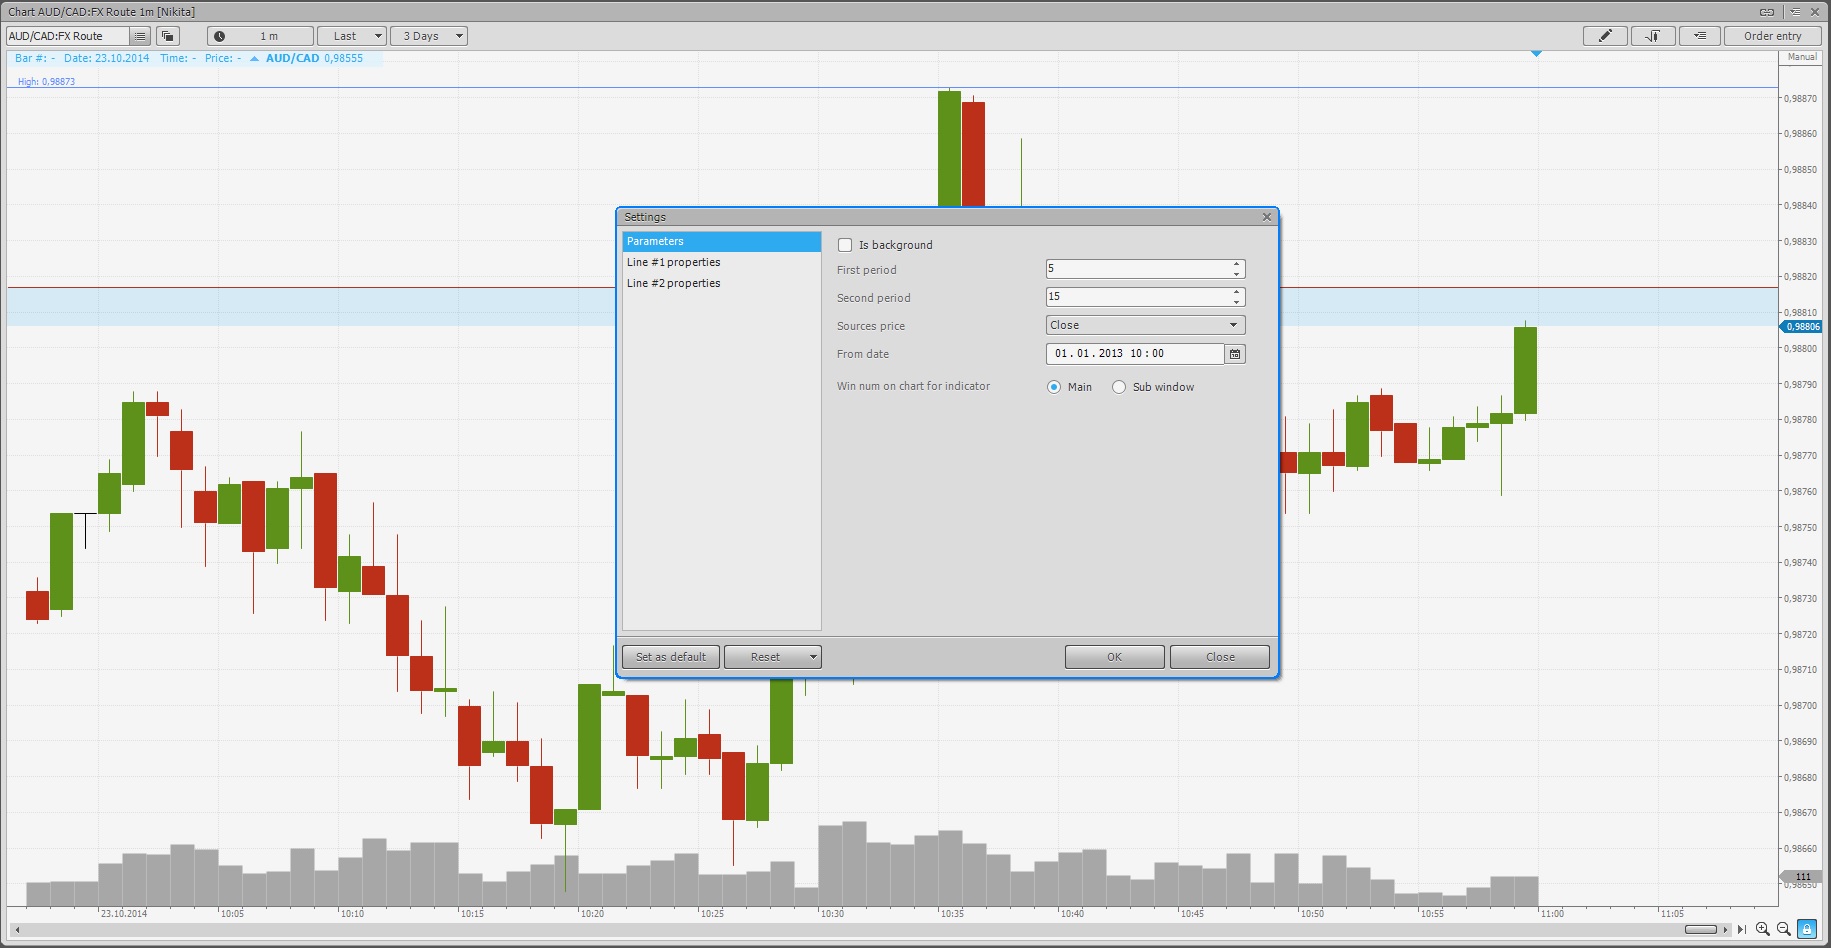
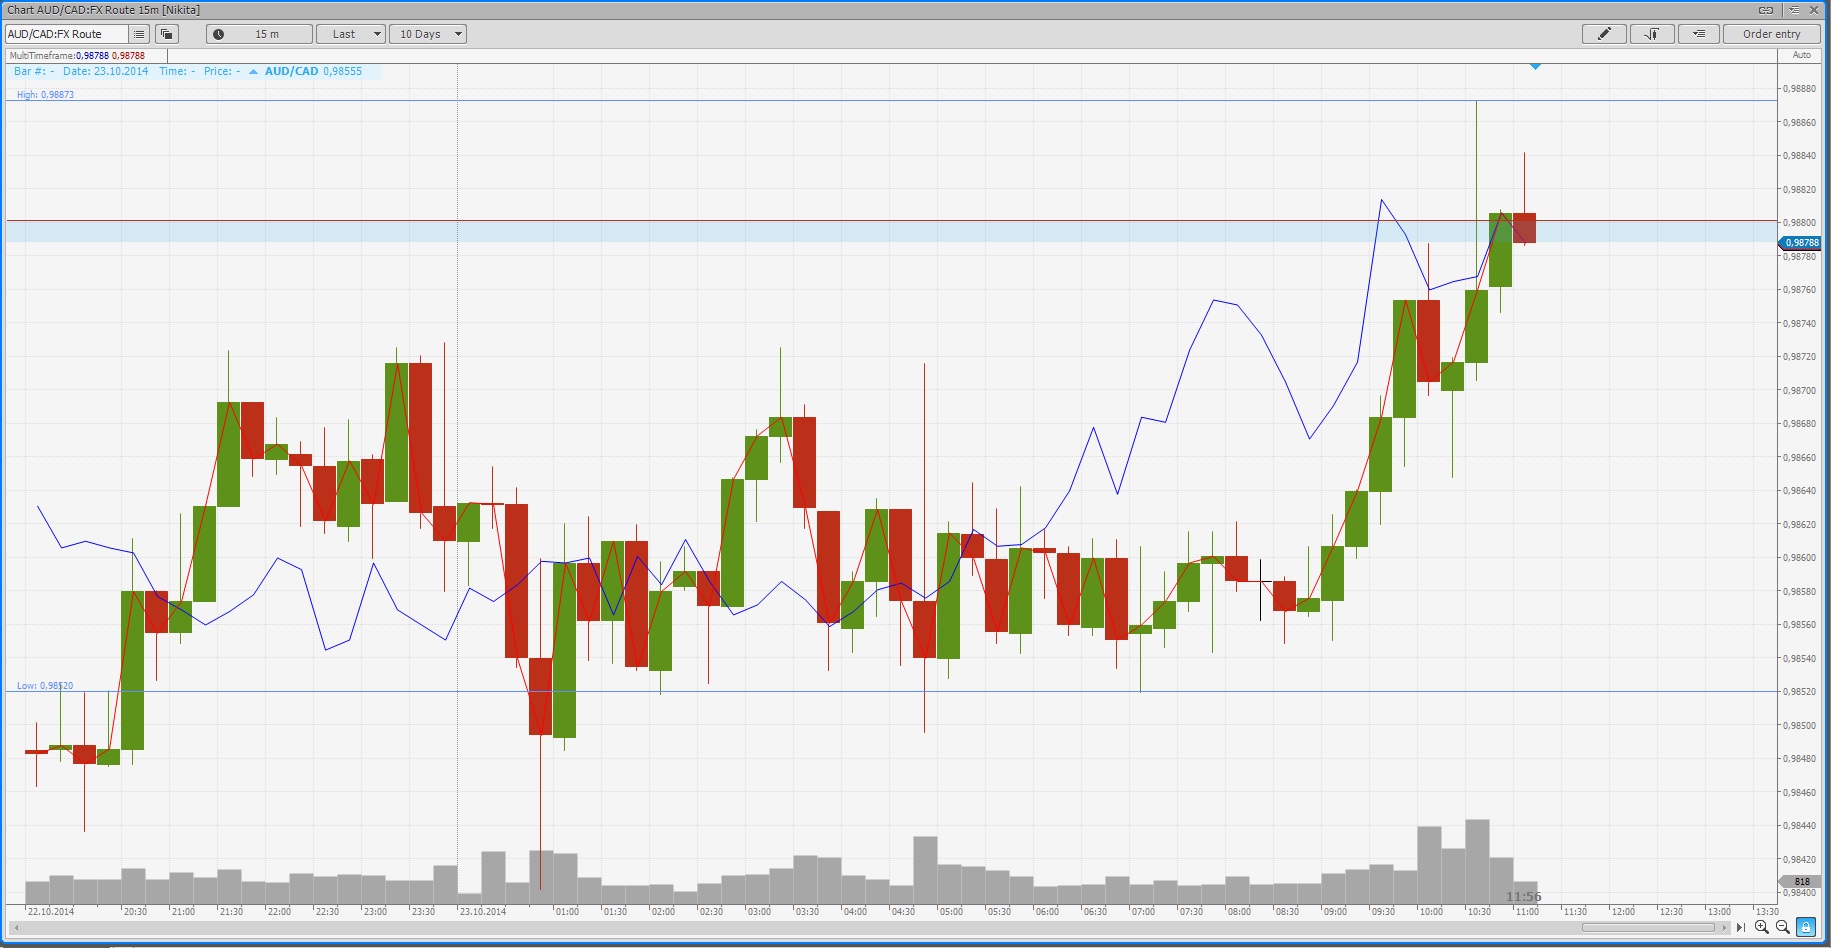
This indicator takes prices from two different periods of the same symbol, and displays them as lines by specified price type. Let’s accept periods, price type and left boundary of the historical data as input parameters for the request.
At first, we need to load the historical data using HistoricalDataRequest:
 HistoricalDataRequest DataRequest1 = new HistoricalDataRequest(Instruments.Current, Period1);
 HistoricalData1 = GetHistoricalData(DataRequest1);
 HistoricalData1.Load(fromDate);
Data for the second period is loaded similarly.
Now, let’s plot a line by price type selected by user for both periods:
for (int i = 0; i < HistoricalData1.Count && i < CurrentData.Count; i++)
SetValue(0, i, HistoricalData1.GetPrice(PriceTypes, i));
for (int i = 0; i < HistoricalData2.Count && i < CurrentData.Count; i++)
SetValue(1, i, HistoricalData2.GetPrice(PriceTypes, i));
Now, we take data and display it on the chart.
For God sake, Can you please the have example complete code with working sample, I see you already displaying this on chart, Why cant you just share same code for the people tying to learn from the examples. Do you really what people to use your platform or NOT!. Unless you dont want people learn or use your system. This can also avoid people trying to contact support which is again very difficult to reach and no response or takes forever. I hope some one takes these issues seriously.
Everywhere in the documentation there is partial example give which is completely useless for the people who are new and trying to learn.
It will be much easier in the example section if you can have complete working example so that people can try to learn from them.
For example loading the historical data, Consider a simple usecase of loading the multi timeframe data for SMA indicator (Loading 10 period of 5 minute on 1 minute chart).
Hello manjuaav.
I modified the example above by adding:
- loading historical data
- creating MA indicators, which are calculating by using 'CurrentData' and downloaded HD
- some comments :)
Also, I recommend you to acquaint with "CodeBase" section. There are many simple indicators and strategies, which are good for learning.
The 'PTMC' terminal has examples of built-in scripts. You can find them in terminal root folder.
Hello manjuaav.
I modified the example above by adding:
- loading historical data
Just when I lost all hopes, Thank you so Much for taking time and helping.
When i load this on chart, indicator looks/works perfect, However as time/chart get new data,
its not updating, last value keeps on extending the line.
Please Kindly Help.


