Creating a spread/basket chart
I am having trouble creating a spread/basket chart. I pulled one of the other day. But the i have forgotten exactly how i did it. From memory, i just for example entered 1EUR/USD+1GBP/USD on the chart symbol box.. Now i am just confused, i try via the portfolio option, but there is no way i can find to select chart to display after adding the symbols.
Please help!
Replies
Hello,
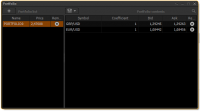
To create spread chart you need to open the Portfolio panel (Tools -> Portfolio). That click "Add new portfolio" and add necessery instruments with corresponding coefficients.
After you create your portfolio, you can open spread chart through Watchlish panel
Regards,
PTMC team
Join PTMC community to post your replies on forum


