Different candles when tick chart refresh
Hi,
I am noticing a strange behaviour, don't know if its intentional.
I use tick candlestick charts, and everytime I do a chart refresh, the candles change.
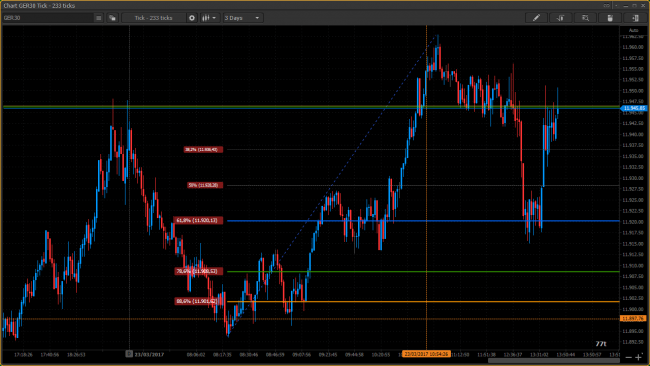
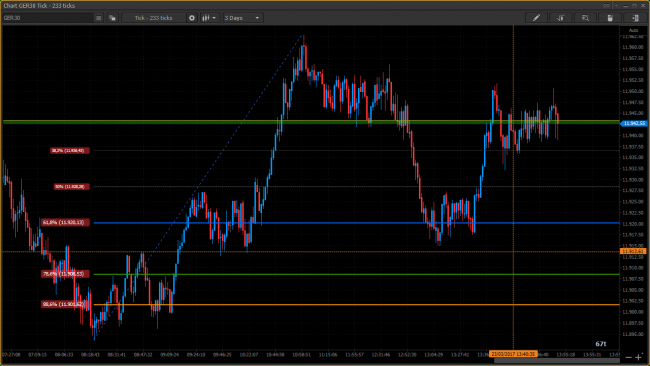
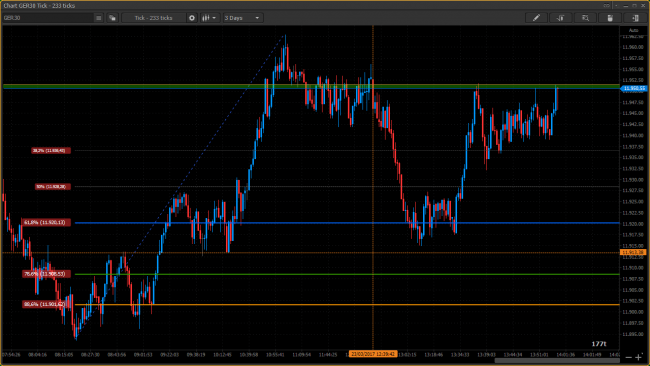
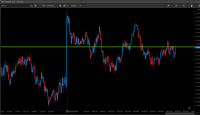
I am submitting 3 screenshots, of the same instrument with the same tick number, but upon taking the screenshot and doing a refresh, the latest candles change.
Examples:
Initial:
Second screenshot:
Third screenshot:
The differences between the first and second screenshots are obvious ( notice the latest few 20 candles ).
In the second and third screenshot, between refreshes, notice the previous top tail is red and then its blue.
The screenshots were done by using the chart , taking a screenshot, refresh, wait some minutes, screenshot and then refresh again. So the differences are between history candles ( after refresh ) against currently drawn candles ( before refreshing again ).
Hope I am explaining it well.
Thanks
PS:
More info:
Comparing with ninja trader:
Seems candles that did not exist before chart load and are drawn afterwards are correct/comparable to what ninjatrader and other tick chart software does. If then, the chart is loaded again, those same candles that were correct, become different, in what seems to be with half tick number.
What I did: Loaded a chart with 233 tick. Waited for some 10/20 candles to appear. Took screenshot. Then did a refresh ( but anything that makes the chart load works ). Candles seem different ( much more candles now ). Changed tick number to 466 ( double 233 ). Compared that now price action looks like what the "live candles" were before loading chart again.
Hi,
More info: launched PTMC today at start of market session and left it for about one hour and half. Then took screenshot (first image ), then in PTMC did a disconnect and reconnect ( caused the charts to reload ) and took another screenshot ( second image ).
You can notice the differences after the start of today session:
First image:
Second image:
I think this example is clearer, as I left it with more time between candles created after loading in.
Thanks !
Hello, Alex!
Thank's for the detailed answers.
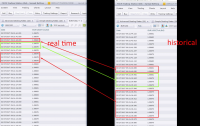
We checked the historical data and real-time data which FXCM provides via the API. And the result: FXCM provides more quotes in the historical data than in real-time.
That's why, after refreshing the Chart, you have seen changes bars on the Chart.
Also, historical data and real-time data aren't the same in their terminal.
About different quotes in real-time and historical data we will write to FXCM Support. We will inform you about results.
Hi again, Alex!
We checked the historical data and real-time data which FXCM provides via the API. And the result: FXCM provides more quotes in the historical data than in real-time.That's why, after refreshing the Chart, you have seen changes bars on the Chart.
It's true and FXCM says that it correct.
Official answer from FXCM:
What happens when you open a tick chart (or any other chart) it gives you the time prices. However, if you re-load the data from the server, we will “back fill” with all of the ticks we actually had. Basically, you see slightly different values, because we update with all the ticks. Both are correct, but the updated one gives a more complete information.
If you want, you can contact the FXCM support.
But that defeats the whole purpose of tick charts !
Its like trading in the hour time frame and having history in 5 minute candles! indicators will also not work this way.
Do you know if the same happens with LMAX or OANDA ?
To be clear, this is not about licensing or who's fault is it. This is about having a properly working solution. If needed, brokers can be changed.
More Info:
Been testing with a lmax demo account, this does not seem to be happen. One particular candle or what not may change between refreshes, but not like what happens with FXCM ( that makes it look like its double or tripple data ).
Also, tested further with ninja trader and fxcm, and following on their forums, also understood what is happening with them: they have their own servers that poll FXCM's data. So it has an option "their historic server vs fxcm historic server". I was not seeing it happening because i had ninjatrader's historic server. Disabling that and changing to FXCM, same thing happened as described here with PTMC.
So this seems to be a FXCM issue only, and not particular to PTMC. What others have done is provide a workaround.
Do you know if the same happens with LMAX or OANDA ?Yes, it same happens on LMAX.
OANDA does not provide tick data via API.
Hi,
Actually I have been trying this morning with an LMAX demo account and it does not seem to happen. Some candles do change a little, but "structure" and "timespan" of overall history chart remains the same.
Don't know if you saw that I edited my previous reply with more info. Another test I have done was to try connecting to fxcm directly with volume candles, instead of tick candles. Volume doesn't seem to have the problem.
Anyway, one thing with LMAX tick charts is that they are way different from their tick charts ( using their web app with it-finance charts ). For example, their tick chart of 233 ticks corresponds to PTMC 55 tick chart in US30.
I will probably change brokers into LMAX, since my fxcm account was more or less a test for a "better platform solution". I will keep also testing PTMC till the remainer of my license, as I extremely like the way to manage trades by chart, its overall usuability as also its c# api.


