

Options trading in practice
Hey there, colleagues!
Today I would like to share with you my observations concerning options trading practice. This article is designed for readers who are familiar with basic concepts, know what an option is, and have notions concerning the “Greeks”. My aim is to show a reader how necessary it is to develop strategies for options trading and what should be taken into consideration firstly.

- What is clustering in trading?
- The naked truth concerning “naked” options trading.
- Where is the mistake of Black-Scholes model?
- What if a position’s volatility changes?
- How to protect your options portfolio?
- What’s in the issue or where’s my “Holy Grail”?
- What’s next?
What is clustering in trading?
A trader tries to use the same trading strategy very often while options trading, and this is the right decision, in case a trader can give a precise answer to the question “When and under what conditions it is good to use a chosen strategy?”.
These conditions’ analysis process is a clustering. What is it? This “scaring” word hides the core of professional traders’ work.
While clusterizing a trading strategy according to any parameter, a trader analyzes cause-and-effect relationship between an examined parameter, such as a price or any report’s data, and between a trading operation result. As you understand, there is a large variety of such parameters, and relations between them and a trade result have a non-linear character. I am going to show you some approaches, which can be really applied in practice of options trading strategy’s analysis.
Now, you can see a very popular naked selling OTM option trading strategy floating around the Internet. This strategy’s slogan is the following: “Sell options, 80% of them are always expired out-of-the-money”. Let’s find out, if it’s the truth… But, firstly, we are going to adjust PTMC platform to work with options.
As you know, it is possible to analyze and trade options using Option Master with the exchange connection to Interactive Brokers and IQFeed. Therewith, it’s important to note, that IQFeed is exceptionally a data provider, while IB besides providing quotes, executes your orders. What does it mean? Trading on IQFeed is impossible, because it transmits quotes and doesn’t allow to send and process trading orders. That’s why there is a realized multi-connection for uniting trading and quoting feeds in PTMC. You can see how to adjust this kind of connection here.
But, because of tickers’ difference in trading instruments on IQFeed and IB, it’s necessary to adjust mapping (a bunch) of these instruments. While a manual mapping of single instruments (separate futures contracts or stocks) is possible, then with options series this adjustment becomes a difficult task because of a large number of series and strikes. But, Symbol Mapping Manager can deal with this task, it automatically creates mapping for all options of a selected underlying instrument. You can get more information about this here.
The naked truth concerning “naked” options trading
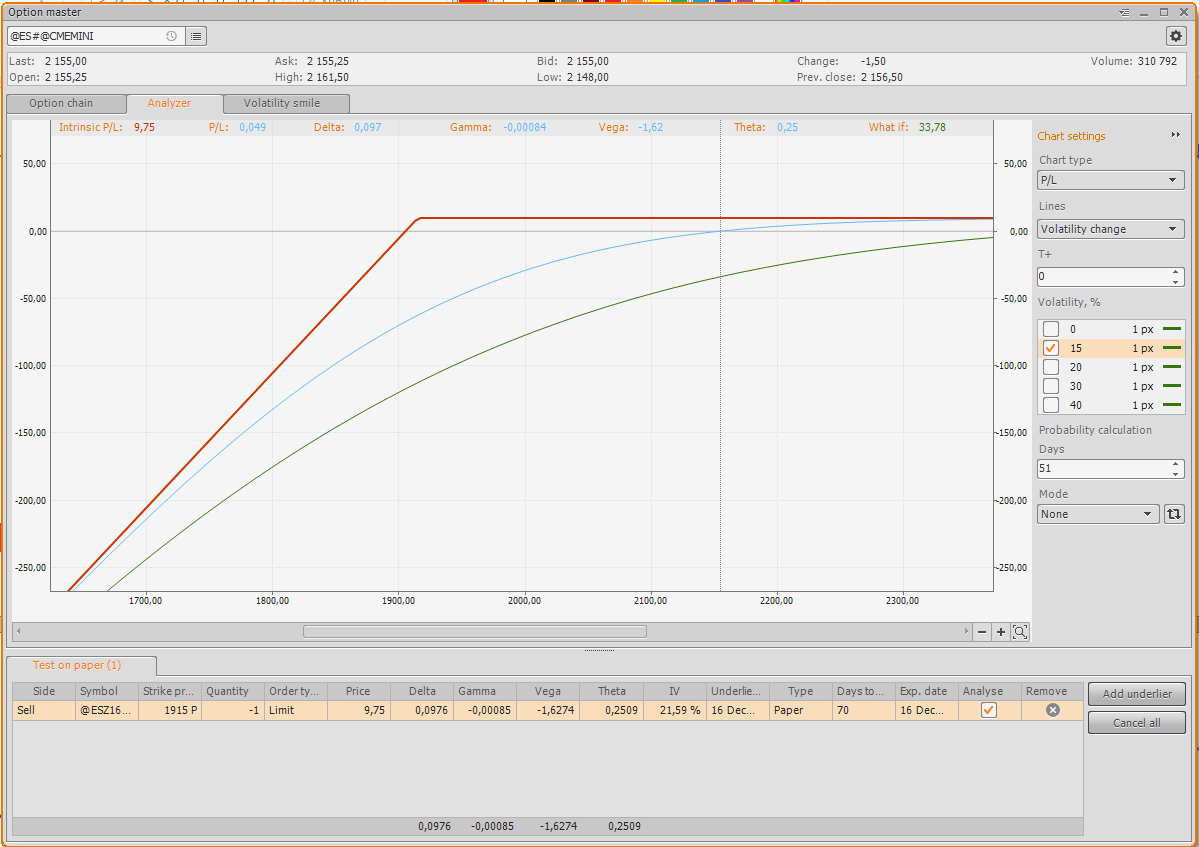
Let’s review all conditions which certainly must be taken into account, if you decide to realize this type of strategy. For an example, we have a December futures contract with the index S&P 500. Imagine, we decide to sell a put option with the 1915 strike price. Let’s build its profile (screenshot 1):
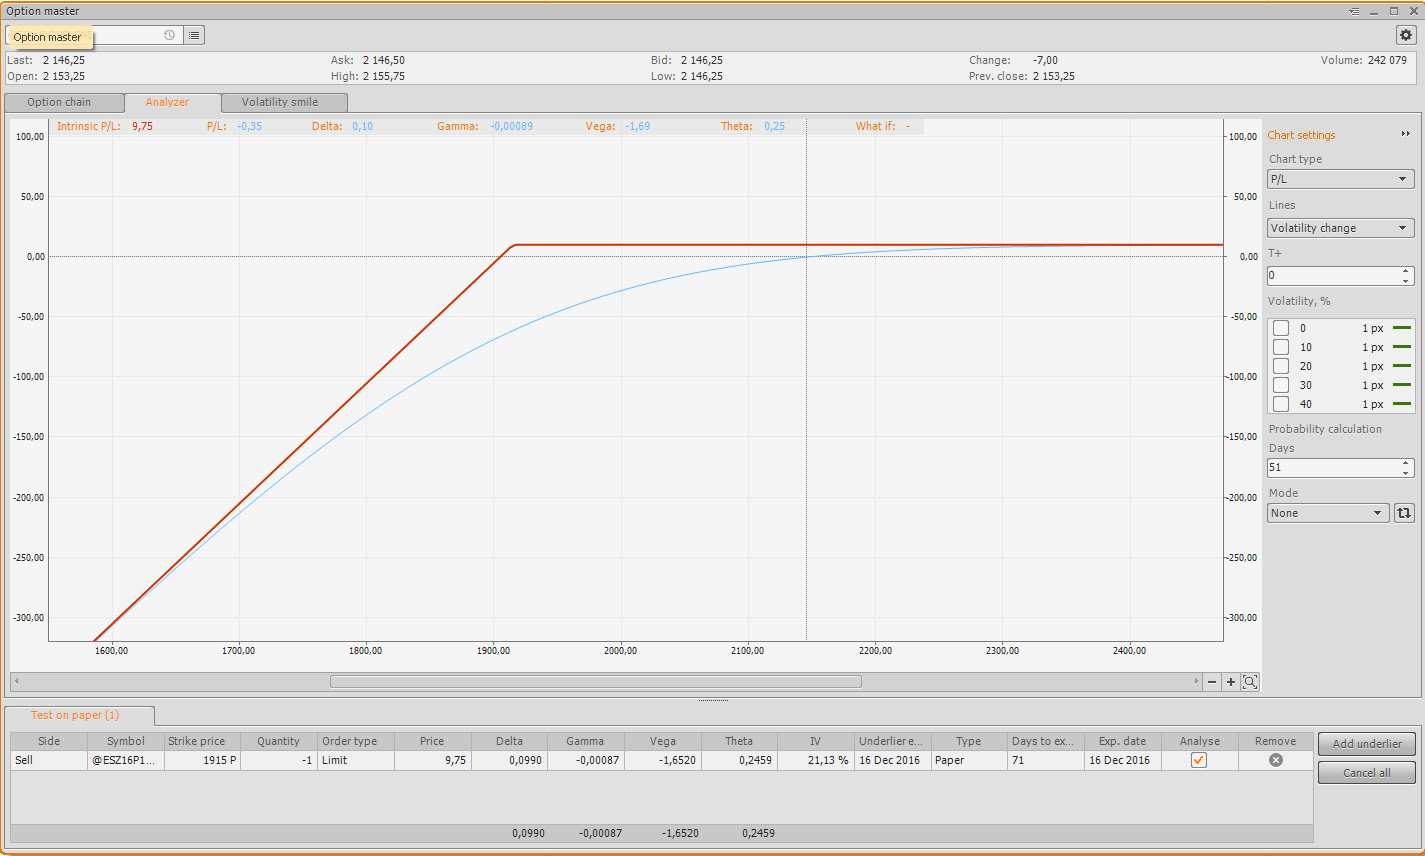
When selling, we get a premium in the amount of 9.75 points or $487.5 for a contract. This will be our profit, in case this option remains out-of-the-money on its expiration date. The “Delta” parameter of this option equals to 0,099, and in simple words, this is a probability of underlier’s strike price touching. Thus, a loss probability for our strike is 9.9%.
Basing on these parameters, we can calculate the Profit factor (PF) and the Mathematical expectation (ME), and we will see the following situation:
PF = (profit probability * average profit) / (loss probability * average loss) = (0.901 * 9.75)/(0.099 * 61.21) = 1.45
ME = (0.901 * 9.75) - (0.099 * 61.21) - 2 * Fee = $116 (when Fee =$10 for a side)
These indicators testify statistical superiority; however, this stage forbids such an easy calculation. Let’s find out why…
Market is not distributed in accordance with the normal law!
Understanding this is extremely important! The “Delta” parameter is calculated based on different models (for example the Black-Scholes model), which, in its turn, are based on the normal distribution. Hence, it follows that the probabilities, which we have used for our calculations, are wrong! So, the questions come: “How can we get right probabilities? How is it possible to calculate a market distribution law?” An answer: in no analytical way, which means there is no a unique formula! Market distribution always evaluates, the distribution law is close to the longnormal one and always changes.
Empiric calculation methods will help us in resolving this task. If the market distribution law can’t be described with a unique formula, then it can be reconstructed! How can we do it? It works in the following way:
- A distance between a current underlier’s price and an analyzed point which it’s necessary to calculate a probability for, is calculated. In our case, this is a distance to a strike price of option.
- Random points on the underlier’s historical prices are selected, and the distance calculated in the item 1 is plotted from these points.
- An underlier’s price is modeled X steps forward starting from a selected point, where X is a number of working days remaining to an option contract trading expiration.
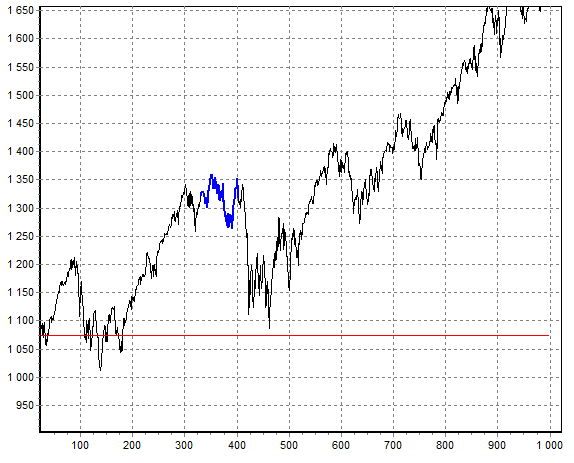
You can see on the image above an example of probability calculation using real exchange data.
- the blue line is a process modeling,
- the red line is a plotted distance (a selected strike).
How can we get a real probability from this incoming parameters array? That’s really easy, let’s take the touching of the blue line to the red line as 1, and absence of this touching as 0. Thus, we will calculate how many times an approach to the analyzed point (our strike) happened in the history. Dividing a calculated value by number of experiments will give us a needed probability!
This kind of calculation is much more precise, than calculations realized with using the normal distribution law. We will get the following results for our example:

Probability = 11.4%, while Delta = 0.099. This is one more reason to use PTMC, this terminal has an already realized “right” probability calculation mechanism.
I would like to draw your attention to the fact that I have indicated 51 in the field Days of the Probability calculator settings, despite there are 72 days before the option expiration. Why? That’s very easy, 72 days are related to the calendar period, and we need to convert them into working days: 51 = (72 *21) / 30. Why do we need this? An answer is easy again: during holidays an option’s price is reduced the same way as during working days. The Theta parameter is responsible for this peculiarity.
Let’s recalculate our indicators Profit factor and Mathematical expectation with taking into consideration new data:
PF = (0.886 * 9.75)/(0.114 * 61.21) = 1.23
МО = (0.886 * 9.75) - (0.114 * 61.21) - 2 * Fee = $63 (where Fee =$10 for a side)
Where is the mistake of Black-Scholes model?
Option-pricing models have one essential inaccuracy: they use a plain volatility smile. This means that when modeling a temporal option price, an IV of every separate strike in a profile is used. This value is unchangeable and is used for plotting every profile’s point of a position in a determined underlier’s price change range.
This model brings in a big inaccuracy, which is necessary to be taken into consideration. The most simple method is a so called “transfer method”. The method’s core is in the following:
- A distance between an analyzed strike and a current ATM strike is calculated.
- This distance is plotted from an analyzed strike to an ATM side.
- A next point following an analyzed strike on an ATM side is taken, and the steps 1, 2 are repeated.
Thus, we answer the question: “How much will be an analyzed strike, if it becomes an ATM strike?”. By moving from a strike to a strike successively, it’s possible to reconstruct a whole timely cost of an analyzed profile with taking into account a current volatility smile!
Another way is by using a hybrid option-pricing model, e.g., Black Sholes + Vanna-Volga. This way allows including the volatility smile into the pricing model.
Let’s apply to our example the method described above. In accordance with the position’s profile, for strike price touching our loss is 61.25, however, this value is calculated for the current volatility 21.36% of the selected strike, when the real volatility of our ATM strike is 13.6% and its price is 50.
Hereof we can make a simple conclusion: in this case we overvalue risks. If we calculate the Profit factor (PF) and the Mathematical expectation (ME) with taking into account current prices, the result will be the following:
PF = (0.886 * 9.75)/(0.114 * 50) = 1.51
Once again, don’t be in a hurry with making conclusions using the calculations described above. We have taken into account the volatility smile, however, not all important factors have been considered.
What if a position’s volatility changes?
We haven’t considered the portfolio’s volatility change risk! Let’s view the “Greeks” attentively:
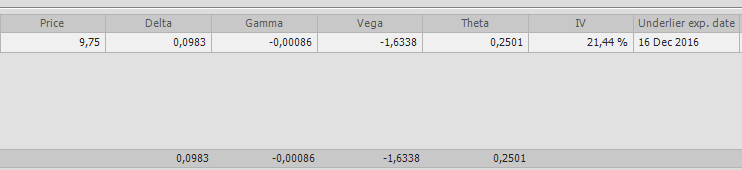
As we can see, our portfolio is Theta-positive and Vega-negative. What does it mean? Everything is very easy, our option’s price will be reduced of the value equal to Theta ($12.505), this value by itself is not linear and grows in accordance with an expiration date oncoming. In other words, at the present we earn $12.505 every day.
At the same time, our portfolio is very dependent upon a volatility change. With a volatility’s one percent increase, our sold option will go 1.6338 points or $81.69 up.
Let’s add a historical volatility indicator on the day chart of futures and let’s define a volatility change dependence upon an asset’s price change.
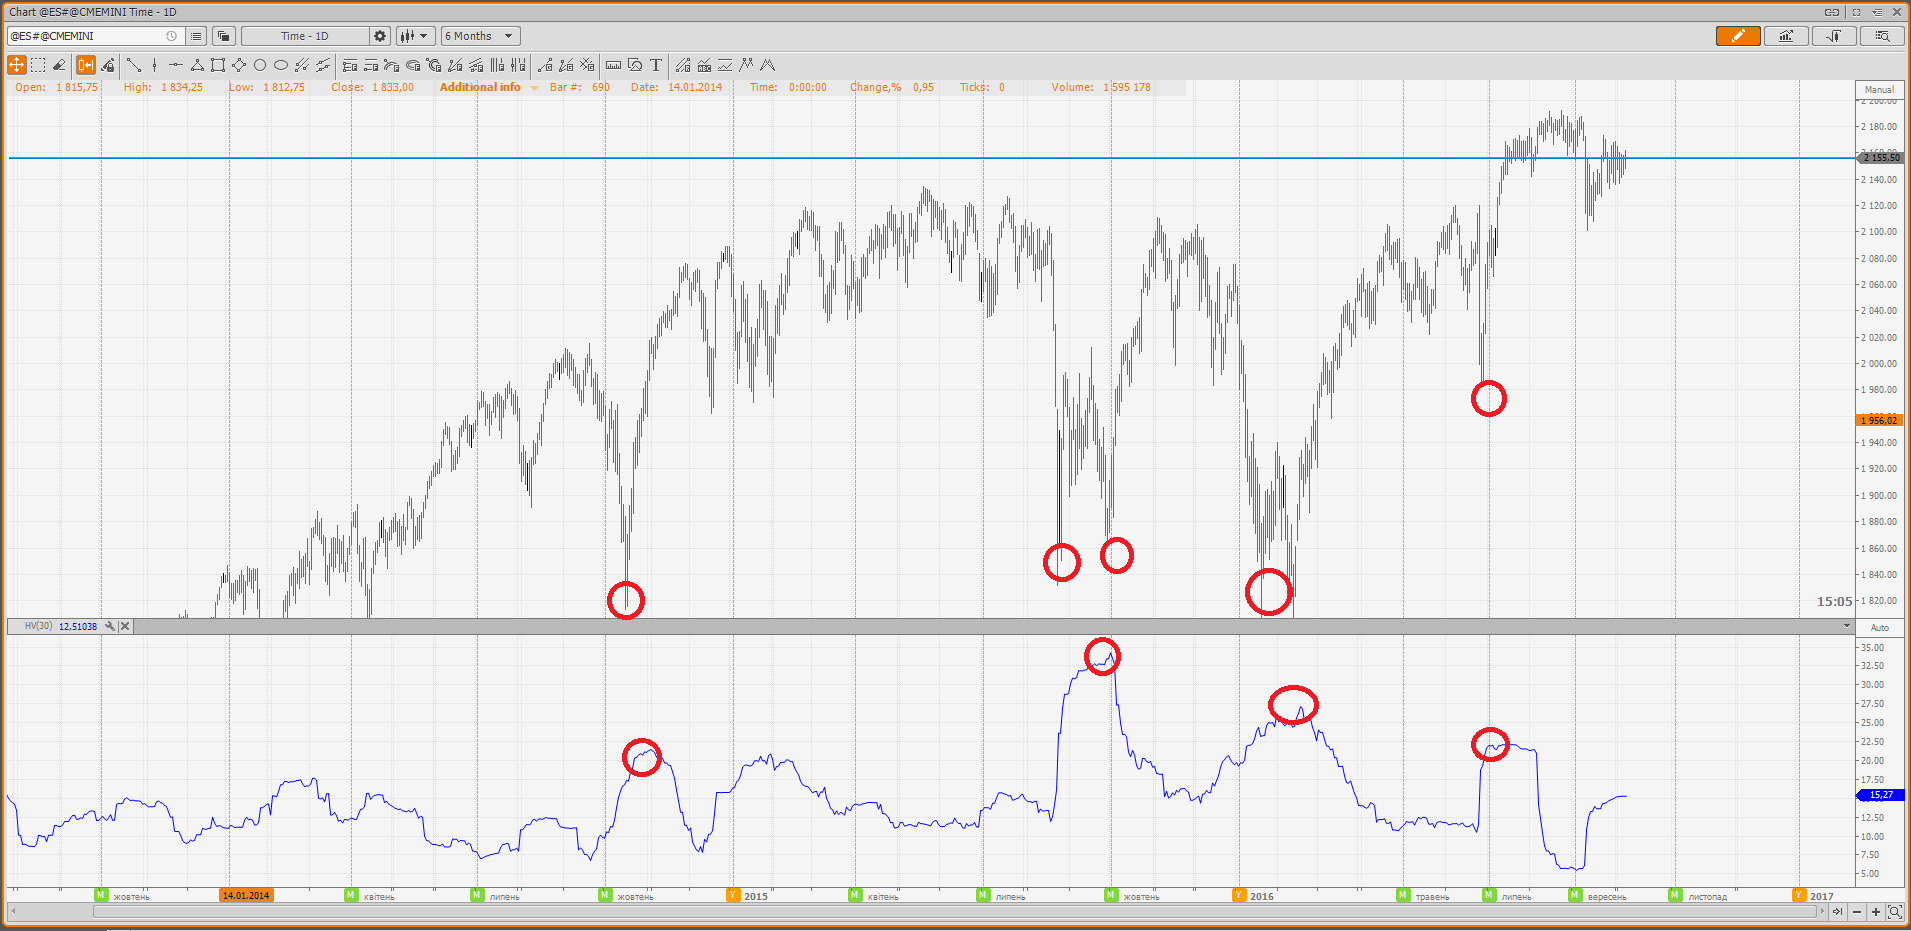
As we can see on the image above, we have a strong inverse dependence, videlicet, a volatility falls with an underlier’s price raise. However, when a price falls, a volatility raises quickly and considerably, up to 10 – 15 %.
Let’s simulate a such situation for our portfolio (image 6). As you can see, instead of an expected modeled risk of 61.21 we will actually get a loss of 112. If a volatility smile is taken, a loss value will be 90 approximately. Let’s calculate the indicators Profit factor (PF) and Mathematical expectation (ME):
PF = (0.886 * 9.75)/(0.114 * 90) = 0.84
ME = (0.886 * 9.75) - (0.114 * 90) - 2 * Fee = - $101.50 (when Fee =$10 for a side)
As you can see, if we consider a volatility raise, our trade becomes un-profitable, this happens because our portfolio is strongly dependent upon volatility and we know, there is a high probability of a volatility raise when an underlier’s price falls.
How to protect your options portfolio?
When selling a naked option, we potentially have an endless risk, this has a directly proportional influence on a used for a such position maintenance margin’s value. With an underlier’s fall our margin used will considerably raise, it will raise with any volatility raise as well.
That’s why we certainly must protect our portfolio from a such influence. How to do it? The easiest way is selling a vertical spread instead of a naked option.
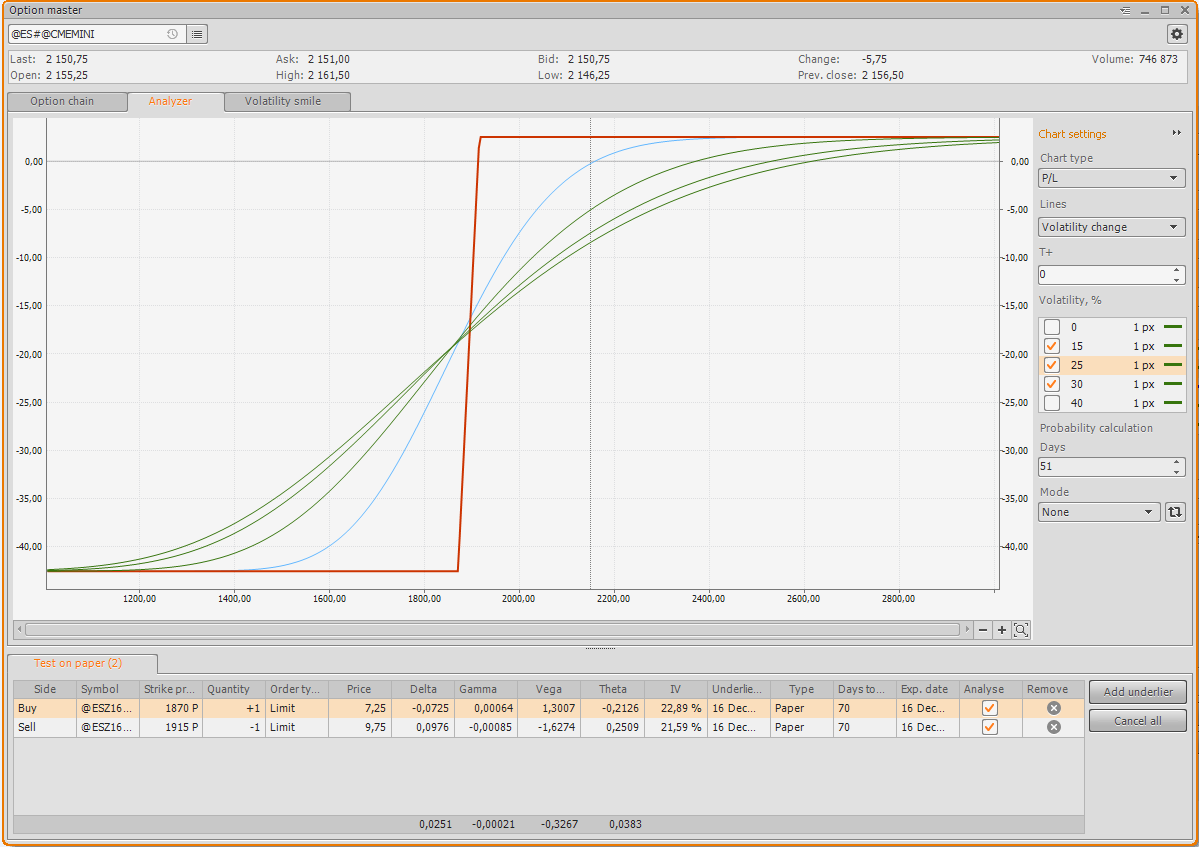
This construction will easily protect us from a strong volatility raise. The screenshot above shows the situation of a volatility raise up to 15%, 20%, 30%. As you can see, with an underlier’s price equal to 1915 a strong volatility change almost didn’t influence the maximal risk.
Also, this position requires a much smaller margin, than an uncovered sale, with a price change against our portfolio, a margin will raise, but very inconsiderably.
What’s in the issue or where’s my “Holy Grail”?
For now, we have taken into consideration all important factors, so, let’s try to model a vertical spread trading on a long history section.
PF = (0.886 * 2.5)/(0.114 * 16.63) = 1.16

A strong fall is a section of the year 2008.
As you can see, on a very volatile market such construction brings a considerable loss.
What’s next?
Next, it is necessary to go through all possible strikes’ and their constructions’ combinations. This research aims at finding an option price inefficiency, in other words, situations, when market participants overvalue or undervalue an option price. These situations happen quite often, especially in commodity markets.
For high quality and profitable strategies building, it is necessary to learn the volatility nature, to explore cause-and-effect relations and understand the main market participants.
Remember! Options trading is a volatility trading, do not neglect this fact, and you will discover your own trading system.
Good luck and a happy trading!
Yours respectfully, Artem Topol.
Have not tried PTMC yet? There is no better way to boost knowledge than to use it! Start trading with PTMC now!

