

Supply and demand on markets
Hey there, Protraders!
It is very common view that supply and demand are forces that drive markets. Sometimes people refer to these forces as 'bulls and bears', 'bids and offers' or 'buyers and sellers'. It's quite obvious that the more bids, the higher price could possibly go, and conversely, the more offers the lower price could be pushed. Therefore, there are many strategies based on volume analysis and supply/demand projections. Basically, higher volume indicates better signal or stronger support/resistance level.
Exchange traded instruments like stocks and futures allow traders to use measured, pretty reliable volume data provided by an exchange itself. This seems very convenient, though sometimes it may be misleading because of dark pools or HFT changing the balance of supply/demand in just milliseconds. Forex traders have way bigger problem since no reliable volume data is available in case of OTC instruments. Forex trader can help himself with a tick-count or a currency futures volume, or partial volume from his broker or aggregator at best, but broker's or LP's volume cannot represent the full market spectrum. Given the above reasons, Forex traders are in desperate need of finding good ways to determine areas where Supply and Demand are imbalanced as these zones may provide certain price movements and profits. Some of these methods are as follows:
Technical analysis is based on relations in historical price movements and certain patterns indicating the advantage of buyers or sellers. Technical analyst measures momentum and volatility trying to find spots where supply or demand may prevail inducing future movement's range and direction. Basic example is Support/Resistance level where many traders decide to cash in profits or trend channel showing tendencies in volatility. Swing patterns, as a part of technical analysis, often suggest shift in supply/demand balance. Like double bottom/top or head and shoulders patterns signal that a trend reversal or retracement may be close.
Here harmonic patterns come to play. Harmonic trading is a method based on volatility, swings measurement, and relations between swings with Fibonacci ratios included. So Gartley or Butterfly formations will indicate supply or demand areas after they are completed.
Candle patterns and Price Action. Candles' bodies show how strong the dominating power is, while wicks signal the presence of counter forces. I.e. pinbar is a classic sign of strong counter force. If price goes down and then market participants start to buy it back, then long lower wick appears. Lower wicks show buyers who pushed the price up. Conversely, strong downward body with small lower wick suggests that bears were fierce, and bulls couldn’t push them away. Then we have certain candlestick formations which could possibly have special meaning, like: engulf, hanger or the three soldiers. All of them have one purpose - to determine whether supply or demand is winning at the moment.
Elliot waves - Elliot analysts are trying to assess supply or demand strength by analyzing waves and corrective moves. They have theoretical models based on observations and they are counting waves as they believe each one of them has its special meaning and place in the whole supply-demand structure/order.
All these methods have followers and practitioners, and we may assume that each one of them proves to be somehow useful and successful as these practitioners didn't 'extinct' yet. But all these methods are different and refer to various traders' preferences, as there is no ideal system or a strategy that would fit every trader.
Couple decades ago traders were very fundamental in their approach. Professionals were using mostly fundamental signals and order flow measurement in their trading decisions. That's how professionals were doing it. The old school is still alive; in 90s George Soros has broken the Bank of England thanks to his fundamental expertise and bold account. Now, the same George Soros, but little bit older, is betting on a stock market crackdown. Same thing here and there. Couple decades ago traders who used Technical Analysis were sitting in a niche and they were considered queers. But eventually, many advantages of TA have been appreciated and more and more traders started to use it as a good method to achieve consistent profits. Fundamental analysis is very difficult and you can never be sure if your judgment is correct and if it will let you earn money. But still too many traders don't ask questions about supply/demand. Tape readers and other traders from exchanges are so much focused on volume, that you don't have to remind them about what is driving the market. But it seems to be different in OTC markets. While professional traders call their contacts to probe market and to get better insight on the virtual orderbook, retail traders seem to be unaware of supply/demand existence. They focus on some patterns they read about or indicators they have on chart. They think that chart is all there is on the market, and don't realize that the chart is only one of many methods to visualize supply/demand in a very symbolic way.
One of few people, who started to analyze supply/demand publically and introduced his way to retail trading community, was Sam Seiden, who once were a professional trader in a big institution. As he says, supply and demand weighing was everything he was doing all day long, day after day. For Forex traders Sam Seiden has a remedy to lack of reliable volume data - he showed how to tell with good probability whether supply or demand might win a battle. In other words, he shows us what we should look for to find good spots with plenty of orders. Sam Seiden is pointing on areas where price consolidates for some time saying that it is a sign of orders flowing, transactions being matched. If such range ends up with a strong breakout, then we assume that plenty of orders are still there and that fact suggests that supply or demand zone has just emerged.
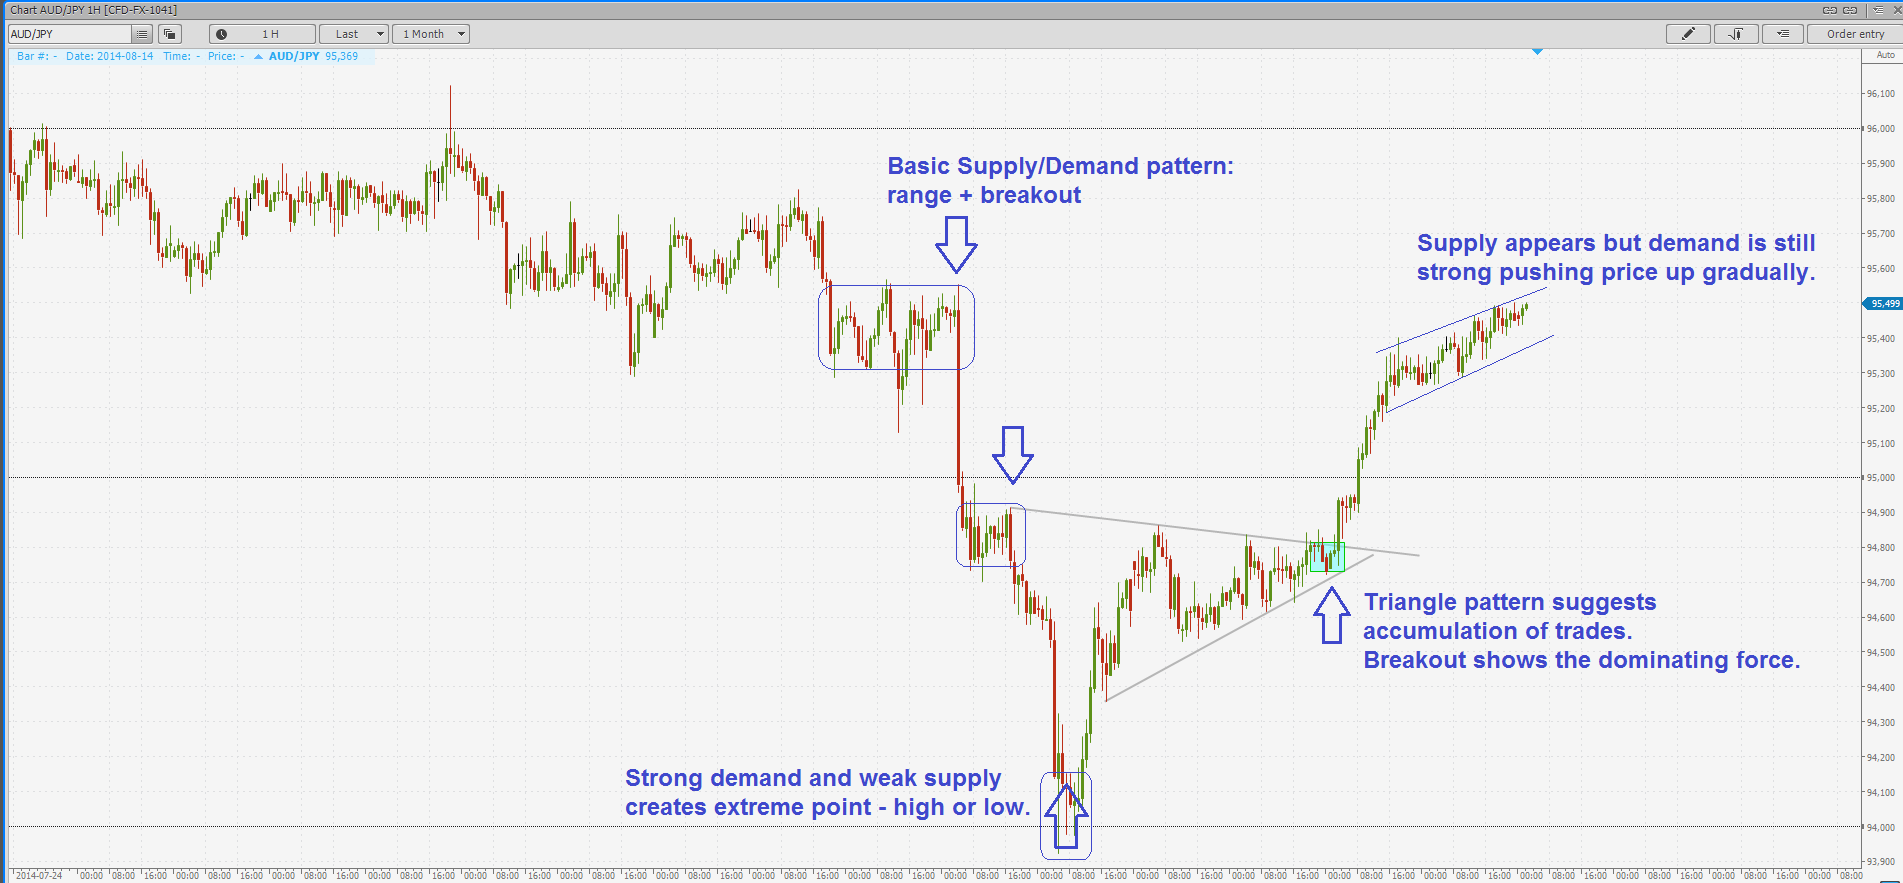
Range/consolidation + strong breakout = assumption that S/D zone emerged there.
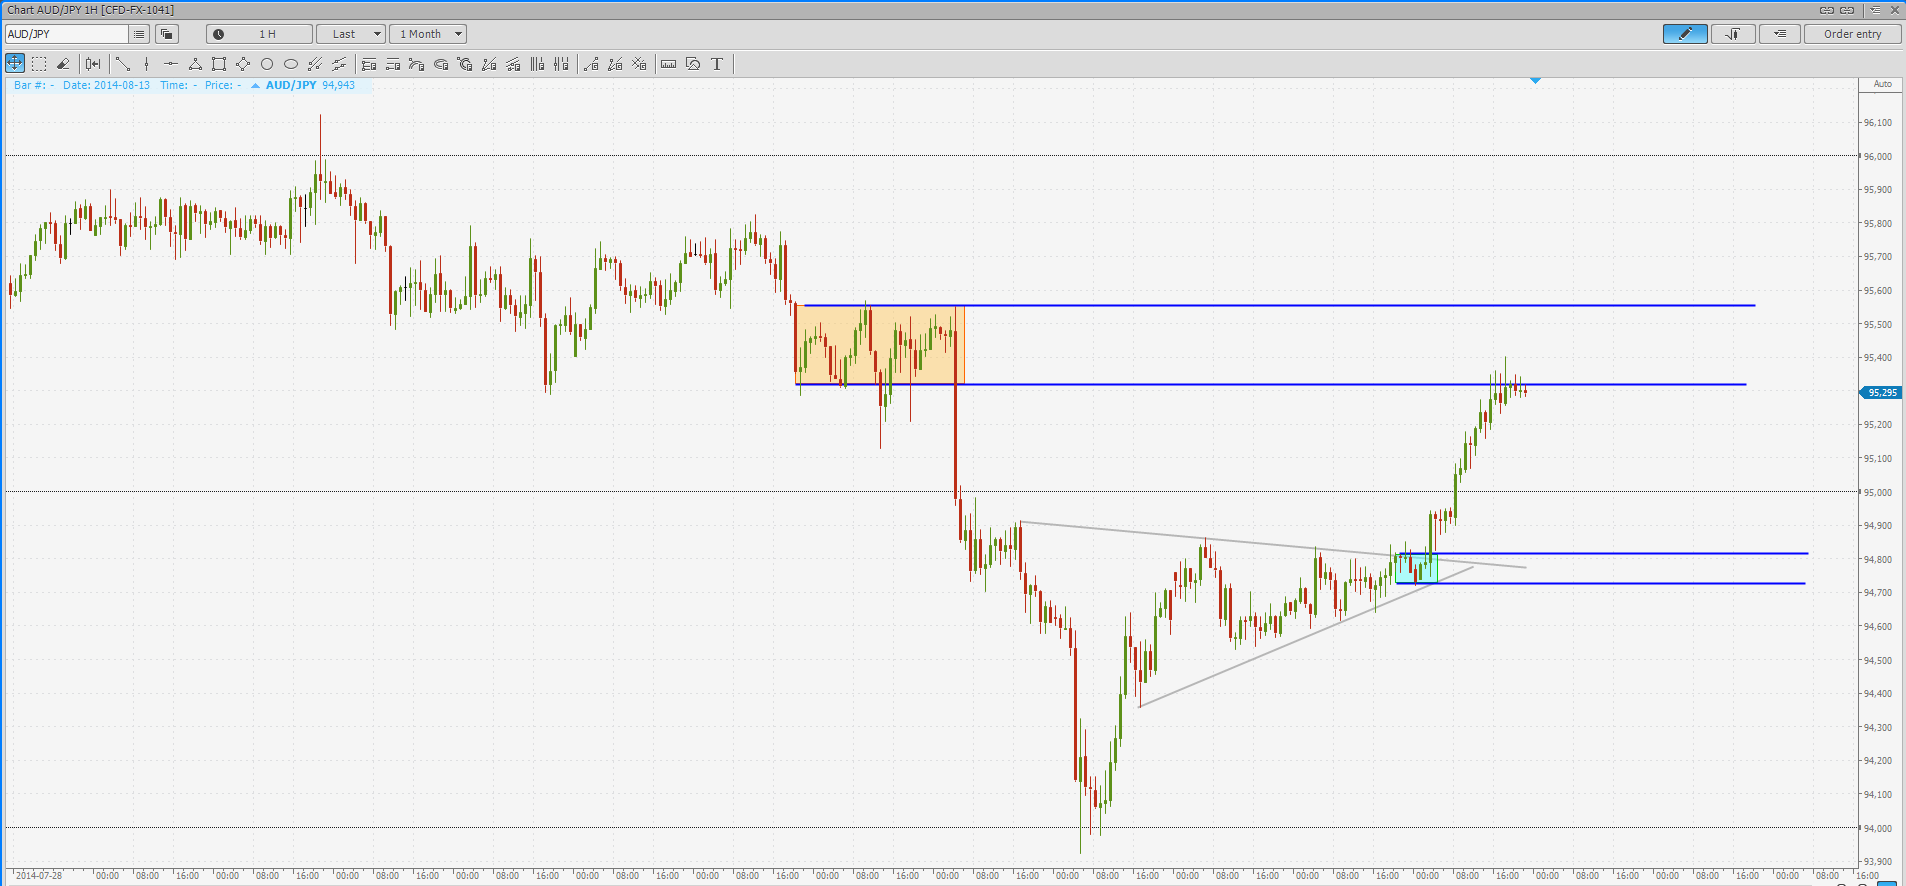
This is how these zones look like. Sam Seiden advices to mark the most extreme point of a range which constitutes S/D zone, and the most important level from the price's side. On the screenshot above, we see small range which was source of a decent drop (orange), and small range (blue) where demand found its way higher out of the triangle. So in this case a technical pattern (triangle) is indicating the presence of buyers.

Therefore, we anticipate selling pressure from actual market price, setting our stop loss right above the peak of our supply zone. Actually profit margin with Target 1 is not enough to keep Risk Reward on satisfying level, so we set partial Take Profit on a first demand area (minor), and the rest should be closed right above next, more important, demand zone - recent low.
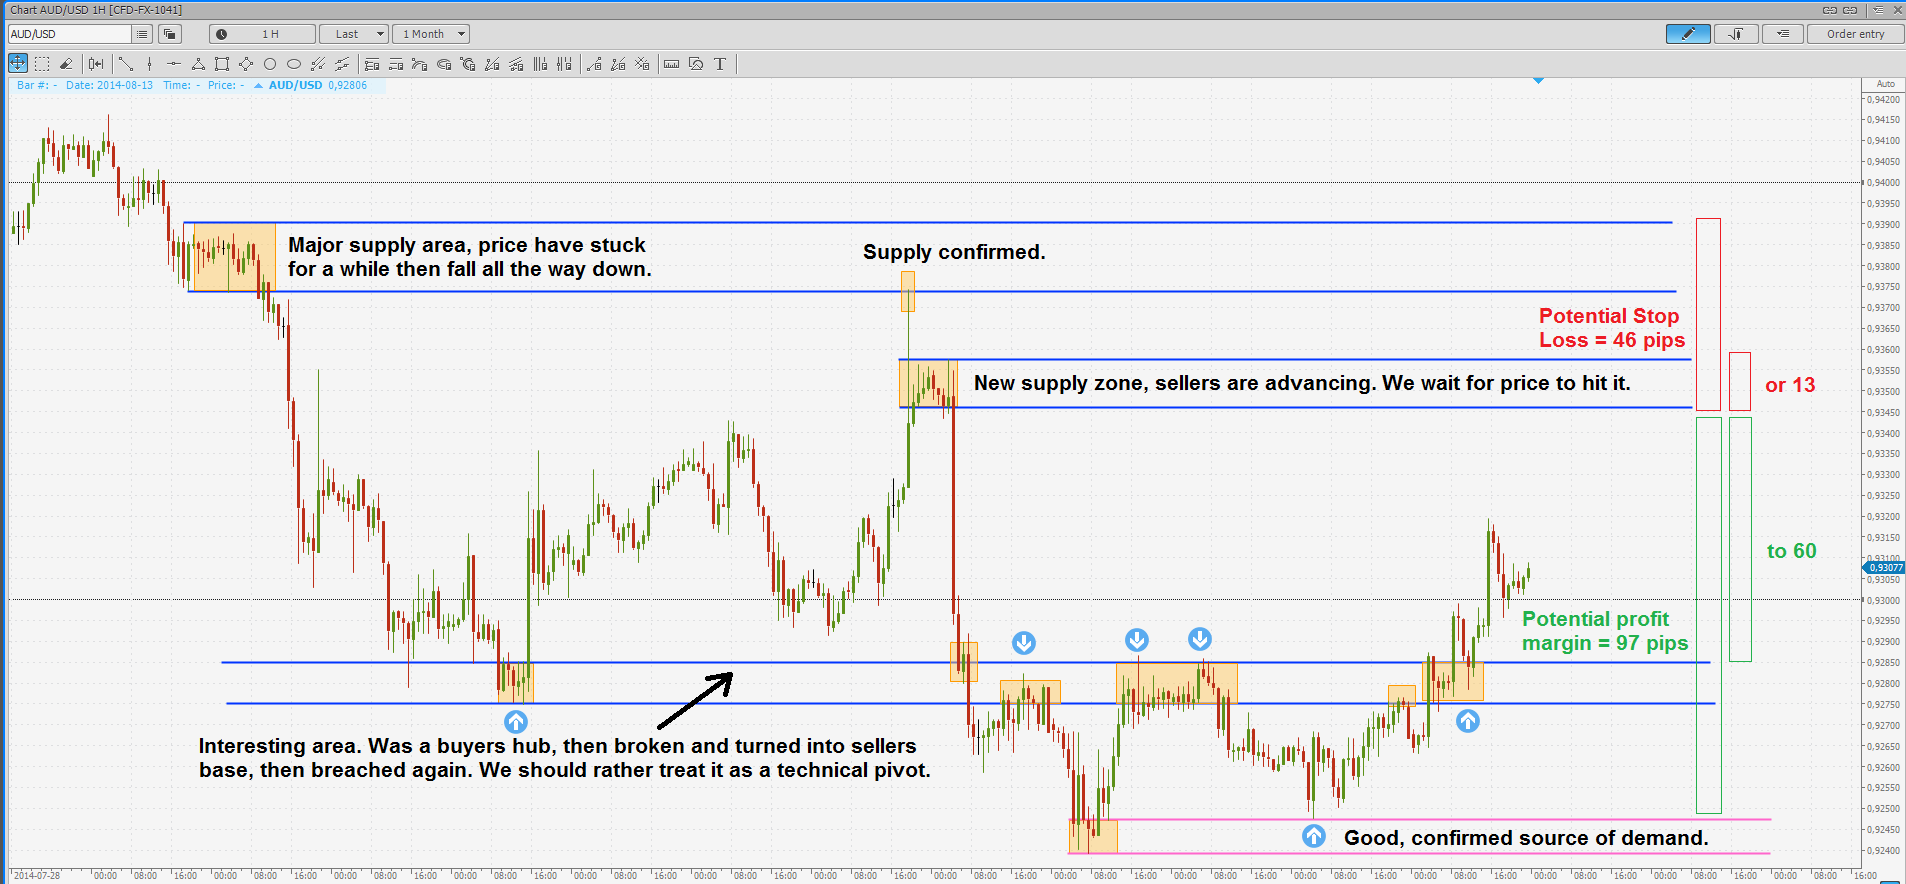
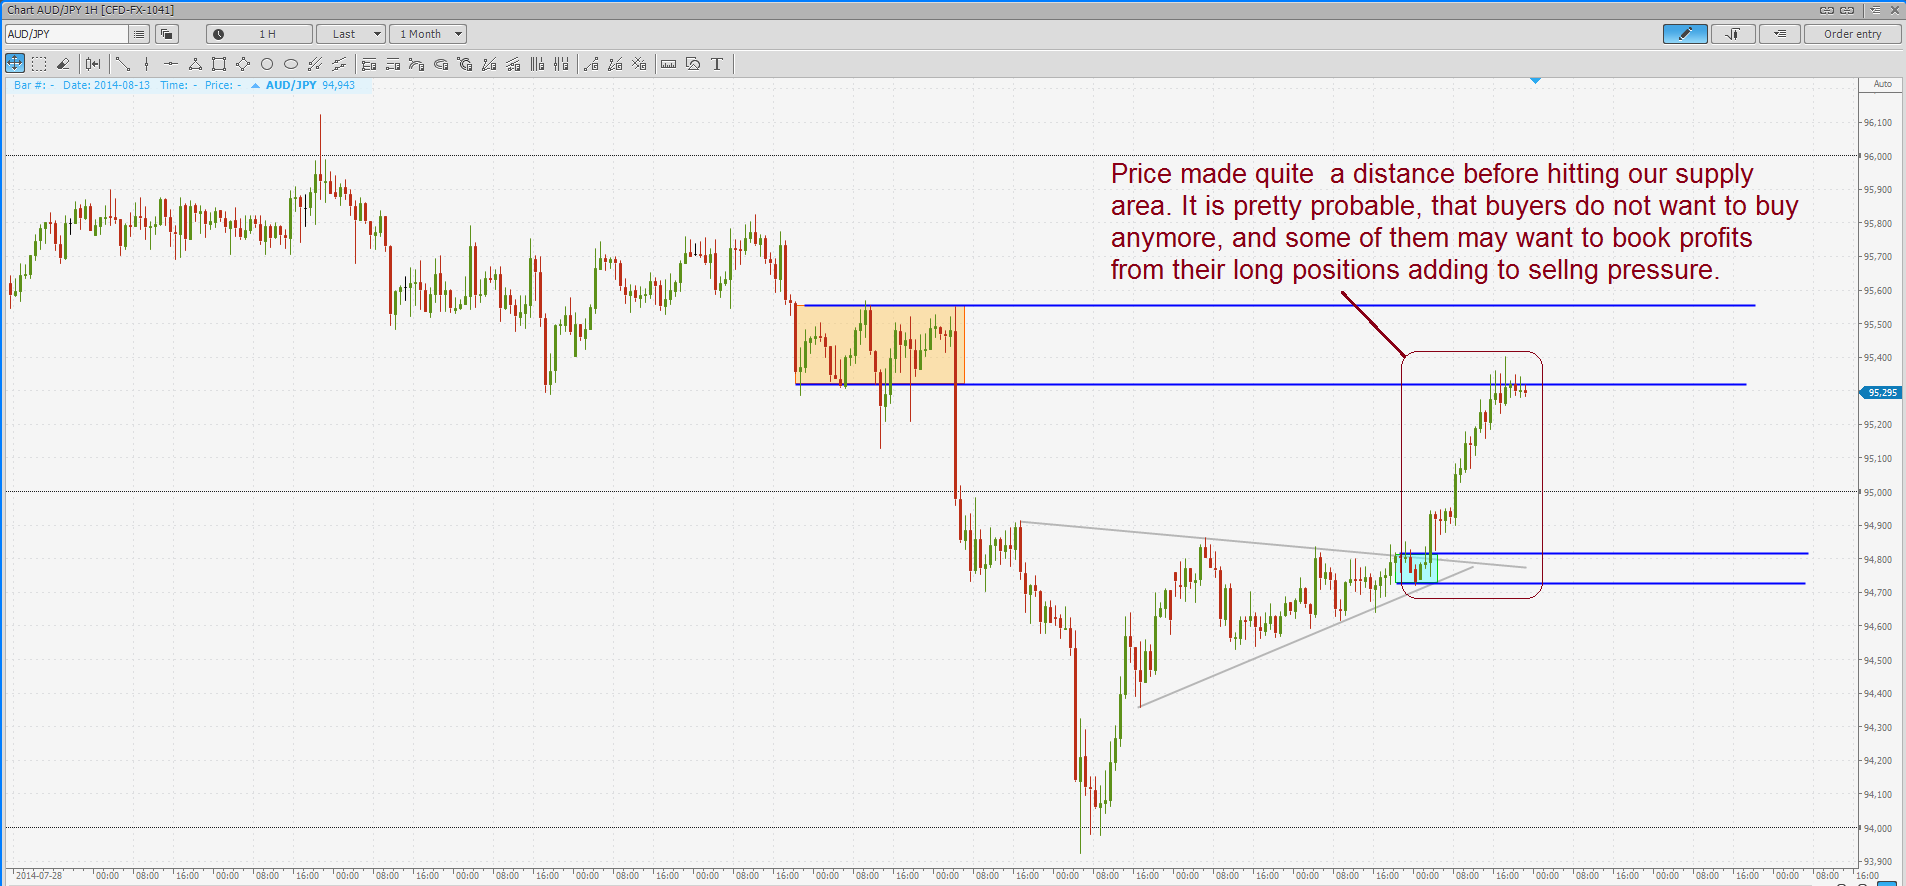
Another interesting example we see on AUD/USD. Strong supply has arisen providing very promising Risk Reward opportunity. Also, we can notice, how demand area had been broken, became supply one and then been broken once again. We also see, how demand zone elevates price once, then it goes down to re-test it, and got bounced for the second time. Such pullback is pretty often and we can treat it as a good confirmation signal, that the zone is strong.
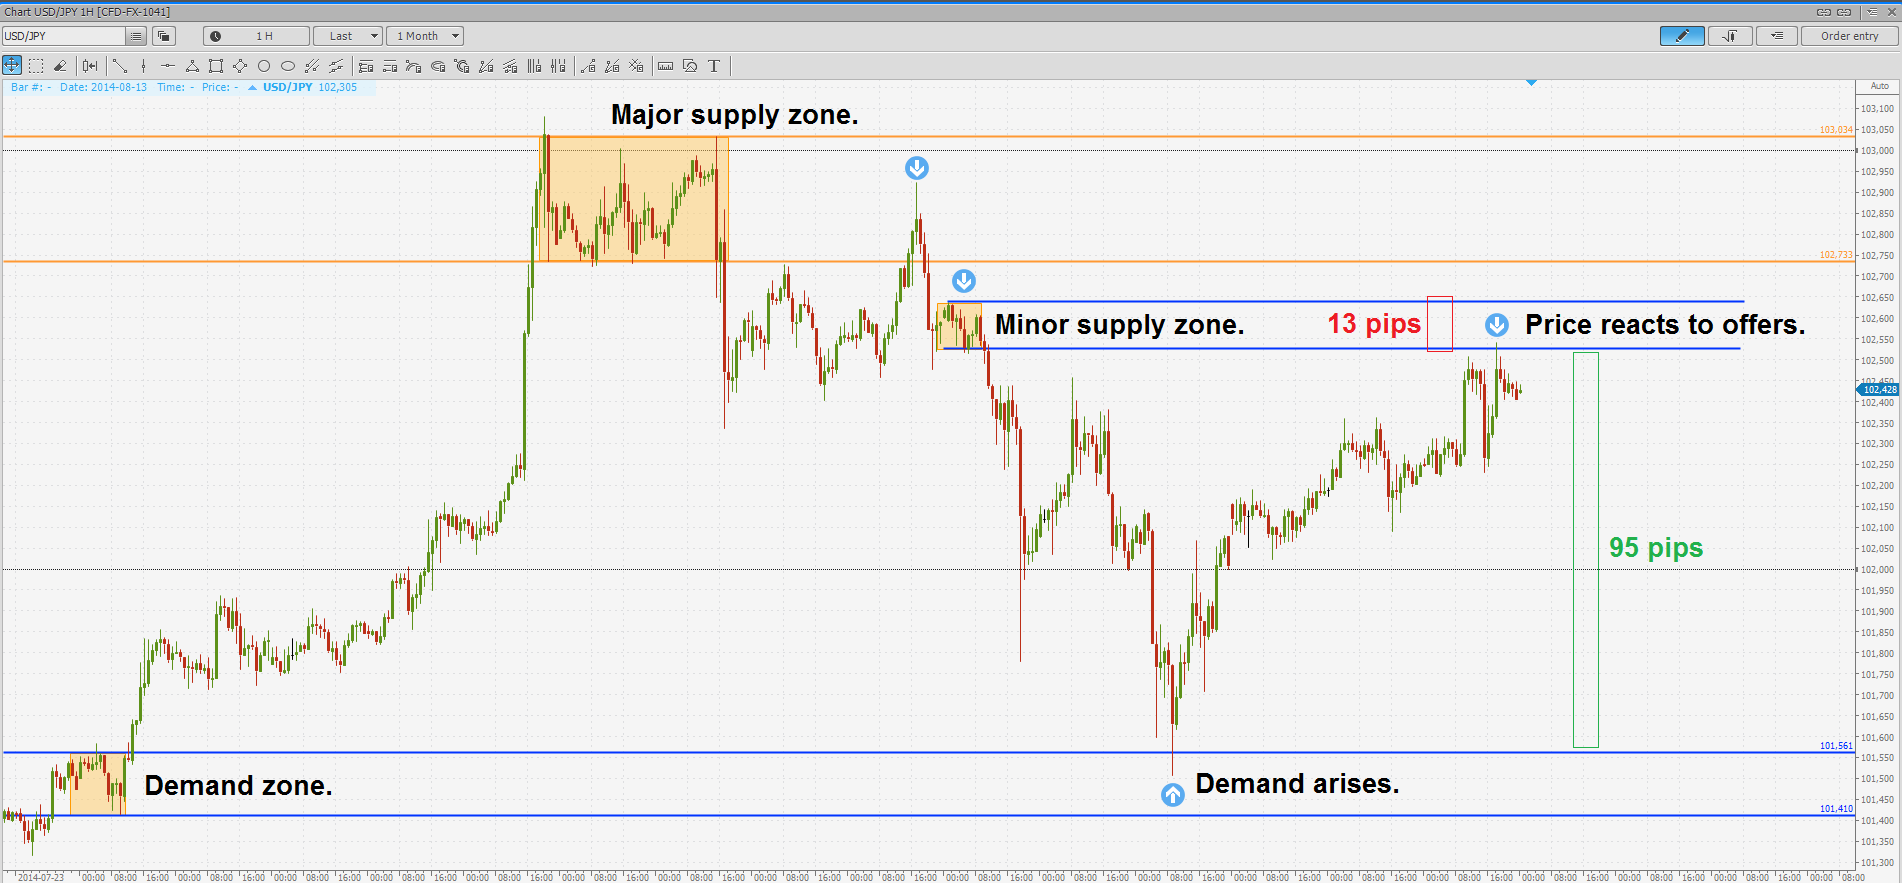
More of trading ideas with very interesting RR ratio. We could use minor supply zone for small potential risk, or the major one, to increase chances of profitable trade.
Stock traders could improve their trading with S/D zones as well.
Supply/Demand is not enough
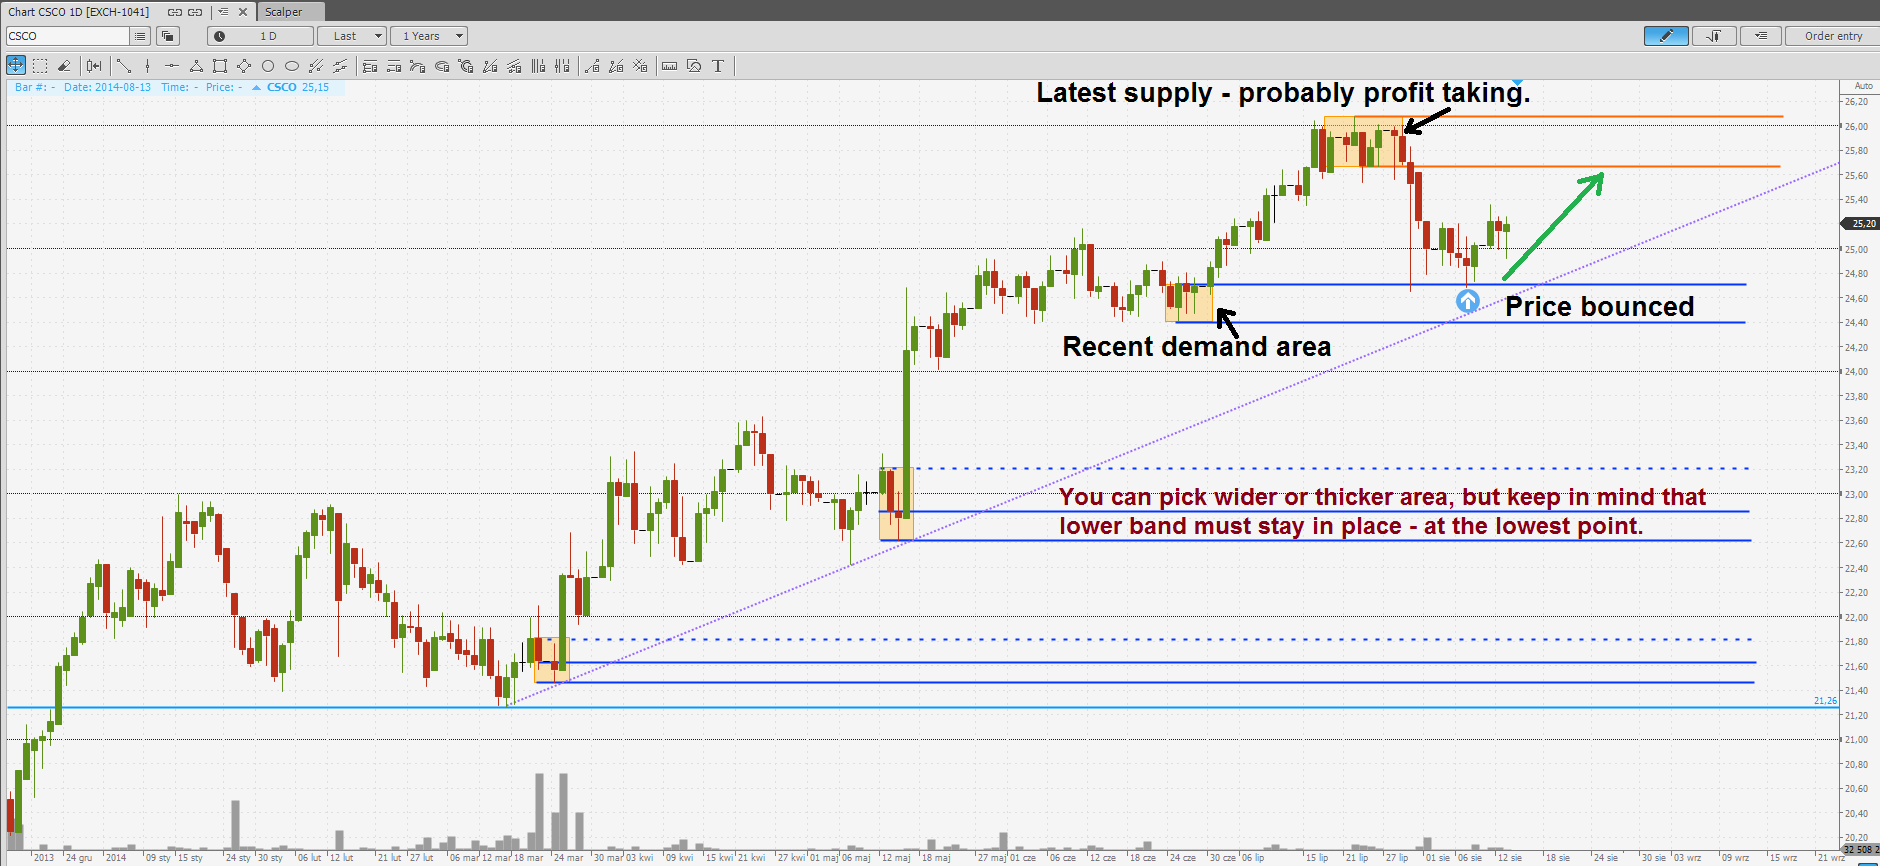
But not all S/D zones are worth attention and risking money. Some of them work pretty good, while other let the price through easily. Then how to determine whether S/D zone is good enough? Please note that, traders using other techniques also have similar problem - they cannot be sure whether their entry level or signal is good enough.
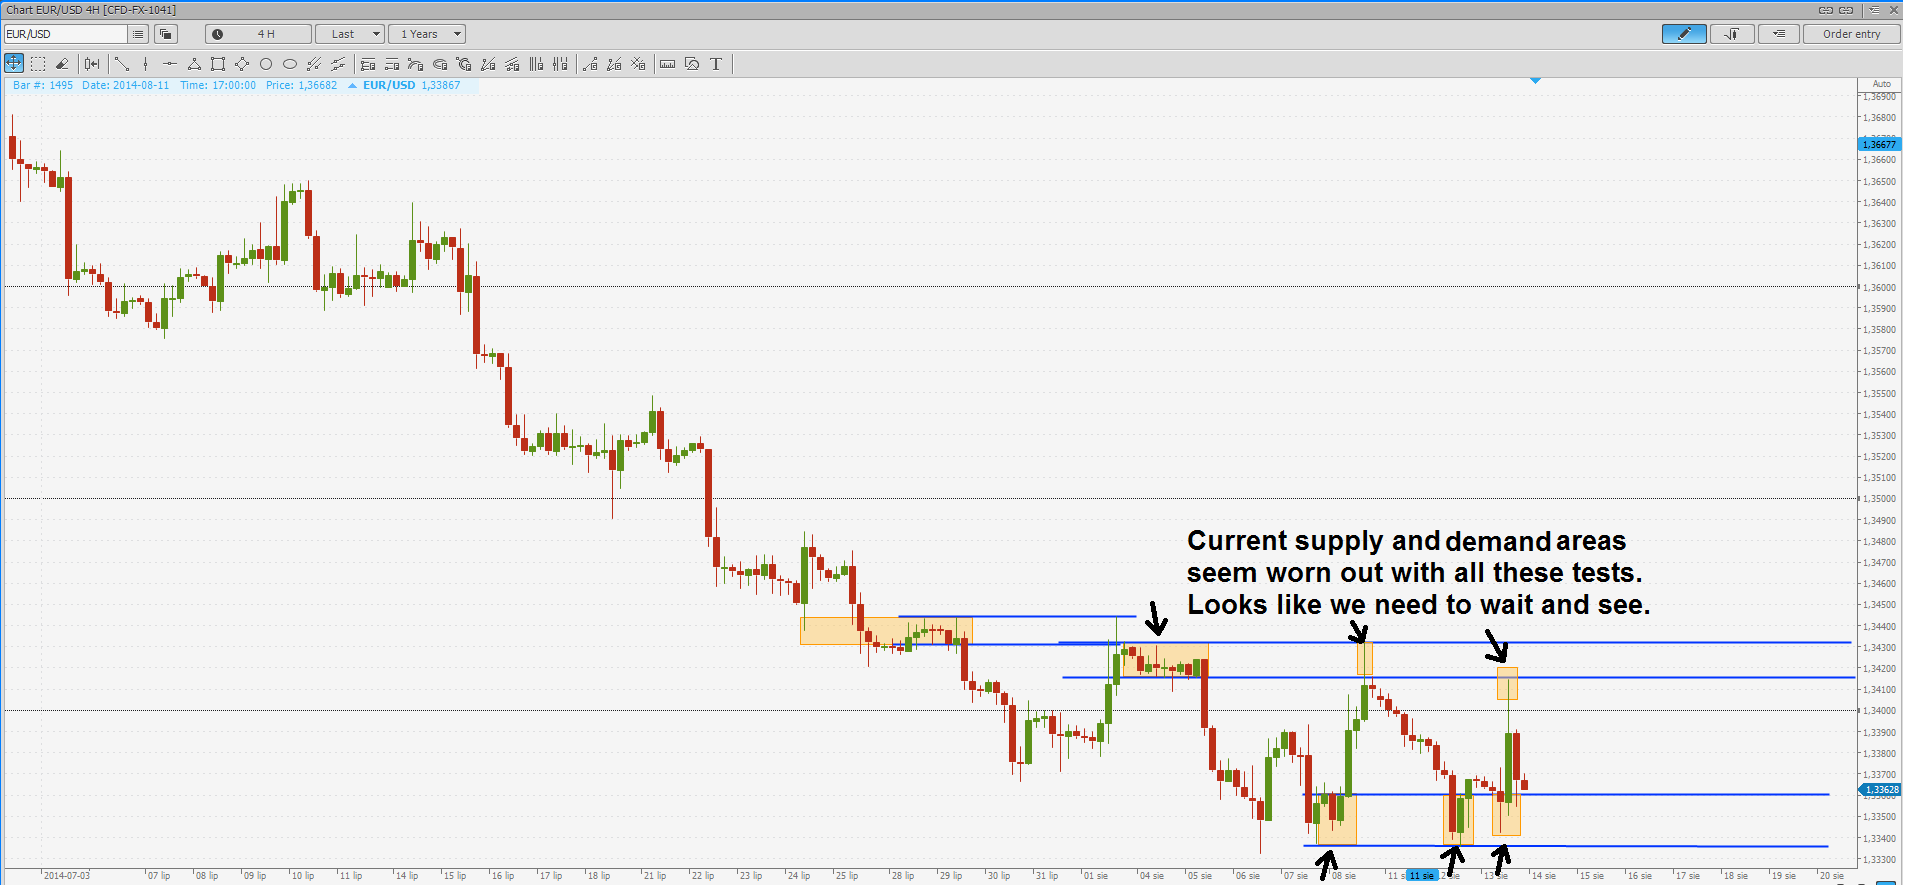
First main filter could be the re-test count. The more times the S/D level was tested in close past, the weaker it should be as more and more pending orders got filled. Therefore, we shouldn't enter trade on second (or further) retest. Only first retest - pullback - seems valid. It's not perfect filter, but it helps to avoid many failures.
Other possibility is to add Bollinger Bands, or other type of average volatility based bands that will show us when price range is extended ahead of S/D zone that we would like to use. Such situation may provide good opportunity for trade - when range is extended in relation to volatility, it is probable that buyers or sellers are too 'tired' to drive price further and many of them would be keen to cash in profits helping the opposite party to gain control.
Here we see mere volatility - price jumps up in a short period of time.
Another issue with Supply/Demand is that these zones won't show us a prevailing direction on the market. There is always some supply and some demand on the market, that's why spread exists and price of an underlying instrument is changing, going up and down in waves. Therefore, if price is about to change, one side must win over the other side and push price through.When you observe charts long enough, you will notice that some levels and areas are being broken all the time while others bounce price even couple times. Our task is to determine which levels will stay, and which will crack when put under pressure. Here we've touched issue about trends that could be a subject for another article.
Please, share your opinions on how to deal with S/D theory imperfection.
Have not tried PTMC yet? There is no better way to boost knowledge than to use it! Start trading with PTMC now!

