

Fundamental Analysis in Protrader
Hey there, Protraders!
Every trader at the beginning of his career finds out that the analysis and forecast of pricing time series can be reduced to the following main types: fundamental and technical. All methods for studying and predicting the dynamics of time series on the base of past price data, such data is open price, close price, the highest price, the lowest price, volume (OHLCV) and all their derivatives are referred to technical analysis. There is a huge amount of technical analysis methods, but all of them have one feature, they are based on the assumption that for prediction of the price dynamics only the past price data is needed (OHLCV). But there is another point of view according to which the prediction of future asset price is only possible by determining the “fair” price of the asset. A fair price, in its turn, takes into account the maximum number of internal and external factors which can affect the supply and demand ratio of the considered asset. Herewith, non-price data, such as interest rates, resources, weather conditions, companies reporting, political and economic news, etc. is mainly referred to such factors. There is an opinion that the fundamental analysis appeared on the American Stock Exchange, as a method of assessing the "intrinsic" value of the company by its financial reports and general trends in the considered economic sector. Often we meet the opinion that the fundamental analysis is the apanage of investors with big money and large-scale plans. And there are some reasons for this:
- The influence of external non-price factors is mainly strongly stretched in time; therefore, the horizon of position holding can reach several years. But this does not deny the possibility of short-term trades.
- To obtain a sufficiently accurate forecast we should take into consideration a large number of different data types. This leads to problems with obtaining, verification and storage of the data. Accounting of the mutual influence of factors also becomes a non-trivial task.
- To understand the influence degree of one or another factor on the asset price, it is required a deep understanding of asset price formation (the production cycle, the main producers/consumers, the structure and peculiarities of supply/demand, the impact of weather conditions, economic and political factors, etc.). That requires a fairly high level of knowledge.
- Possible time-lags between the appearance of the signal and the immediate reaction of the market suggest the presence of a sufficiently large capital to maintain the position.
Let’s consider the main types of the fundamental analysis
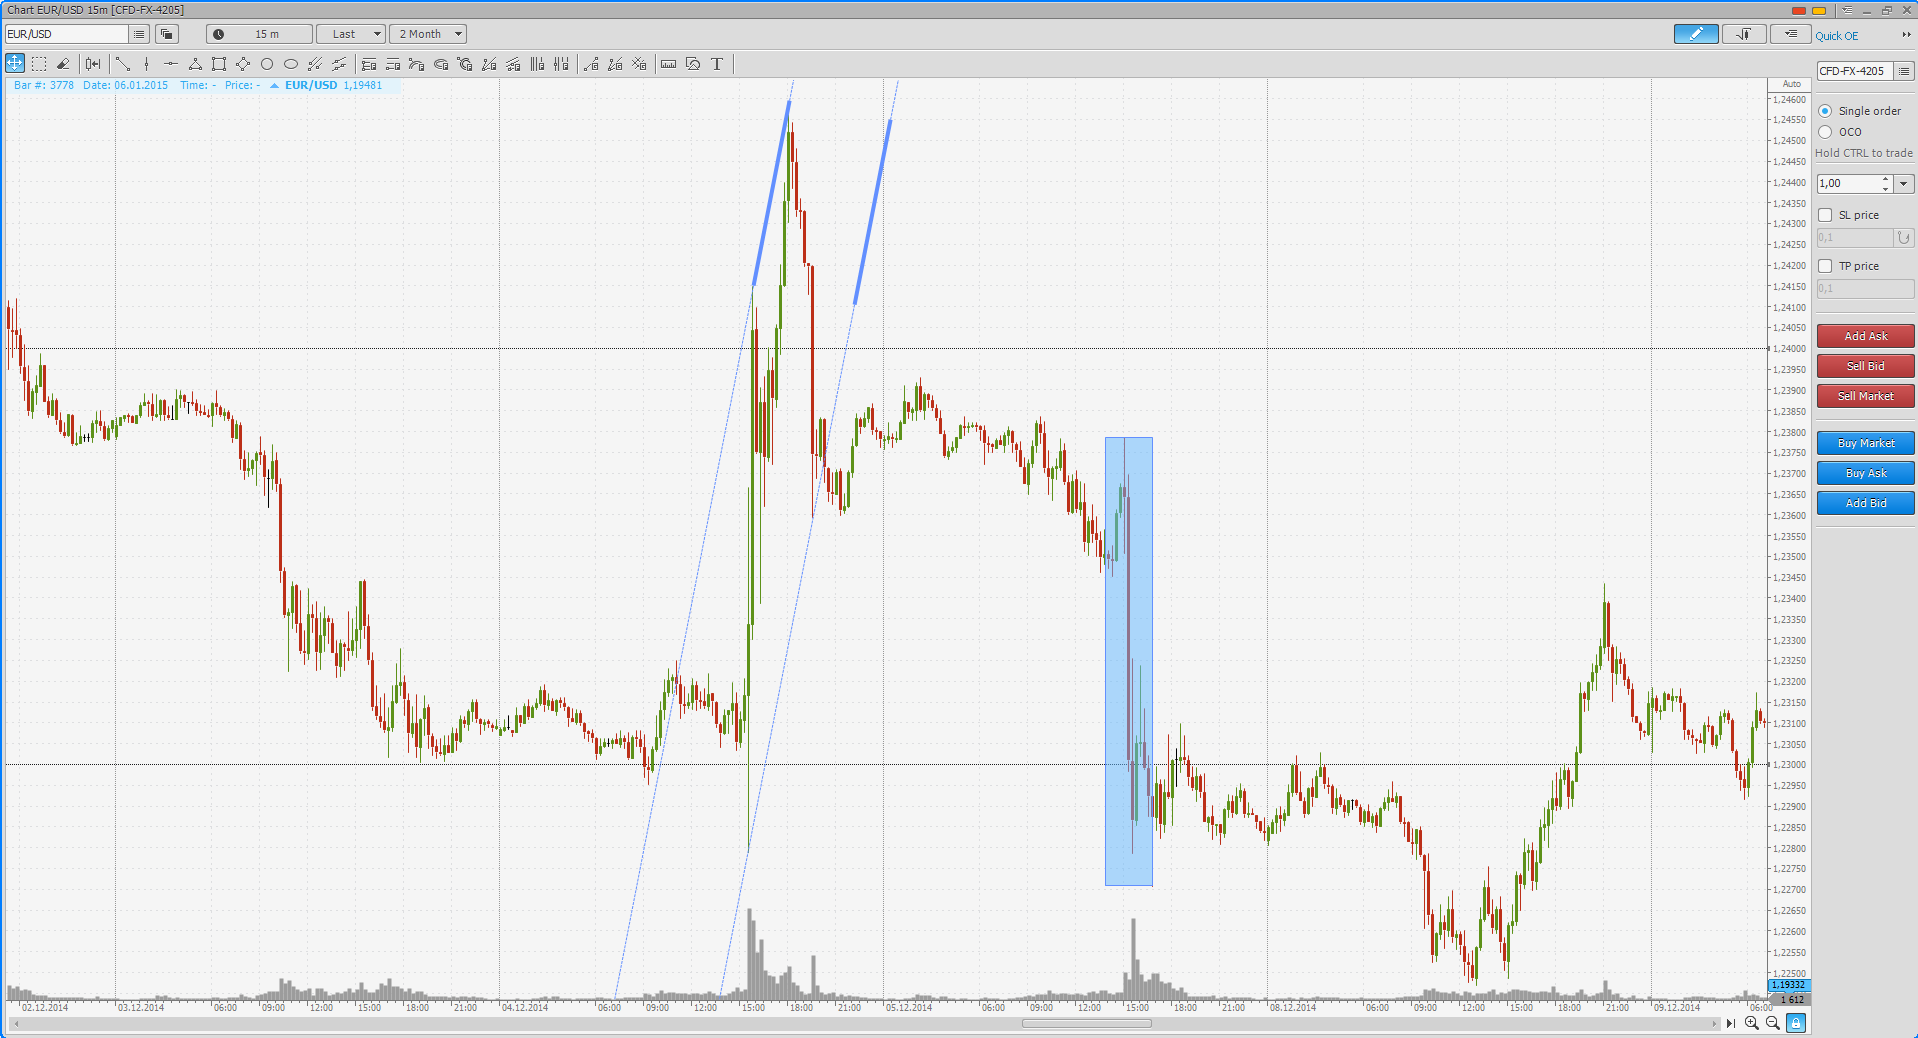
1. Event trading. There is a whole class of the trading strategies which use the short-term impulse changes of the asset price when publishing the various kinds of reporting and news related to the traded assets. So, for example, after collecting the statistics of the currency price reaction on the change of interest rate, currency trader can create a good intraday strategy. Automated trading systems which use news published in the media as a signal to start trading can be considered as a separate subclass of such trading systems. The events of April 23, 2013 were a clear demonstration of the prevalence of such type of trading. When the S&P index fell more than 1% for a minute. Due to false information published in Twitter about the explosions at the White House. Trading robots classified the incoming information as the most negative for the US economy, which caused a wave of selling in the stock market. At the same time exactly the trading robots were selling the index, this has led to the one-stage release of a huge number of sales by market that became the reason for the fall in prices. Taking into account the liquidity of this market, we can understand the scope of means involved by automated systems.
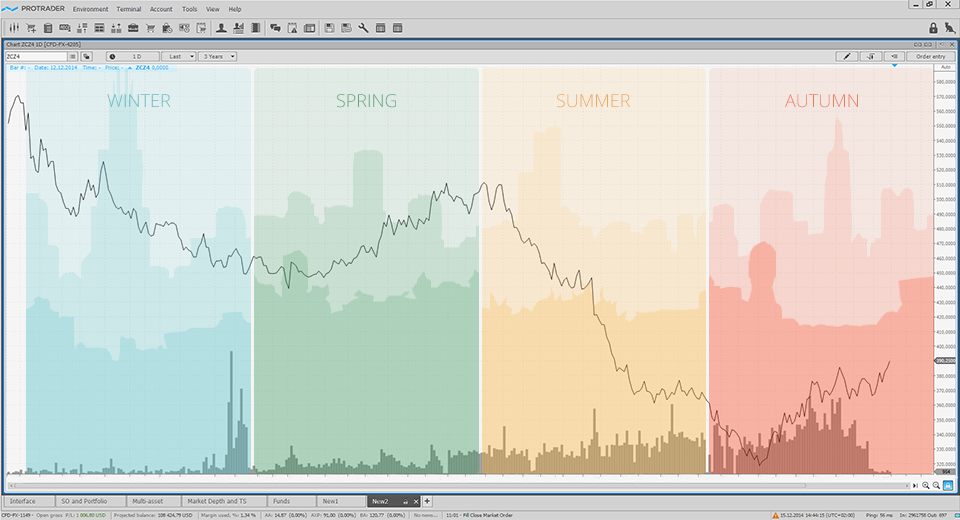
2. Seasonality. Although the seasonality is observed directly in the asset price, I would mention its accounting to the fundamental analysis forasmuch as the cyclical processes that cause it are mostly have non-price character. An excellent example of the seasonality is the growth of energy resource price in the cold season which is associated with the objective weather condition – temperature reducing. This leads to the increased energy consumption and growth of the prices for them. As an example of the seasonal trend we can consider the growth of futures prices for the supply of meat during the barbecue period. Season of barbecue objectively influences on the demand, people actively buy meat for picnics that finds it’s reflection in the meat price. Accounting of the seasonality is actively used by spread-traders who trade different synthetic instruments – so-called spreads. Spreads represent the ratio or the difference in prices of several linked assets. Herewith, spread can be built as between the various assets (wheat/corn, oil/oil products), and between different derivatives of one underlier (calendar spreads). It is worth noting that such trading basically has a very clear economically justified goal - hedging of producers’ risks and consumers of goods. Goods are mostly exposed to seasonality due to the peculiarities of their production cycle and implementation. When trading on the commodities market it is necessary to take into consideration the seasonability. Although to some extent seasonal trends are observed in the majority of assets, the accounting of this data can significantly improve the performance of your trading. But there are some peculiarities of seasonal trend accounting, in my opinion, it is important to evaluate not just the seasonality obtained from the past asset prices, but rather the fundamental factors that generates it. In this case, considering the reasons of seasonal trends, it is possible with a high probability to predict whether the price will move on by seasonal forecast or not this year.
3. Analysis of reporting. Analysis of mandatory company reporting is widely used by traders in the stock market. Knowledge of the report structure and understanding of the economic meaning of the separate data allows to experienced analyst to determine a "fair" share price. In this case, the difference between the actual and "fair" prices will be a signal to open a position in the appropriate direction. If the current shafundamental-analysisre price is higher than calculated “fair” price, then share is considered overbought and short position is opened in order to fix the profit at the moment when the current price will reach the calculated “fair” level. By analogy, if the current share price is lower than calculated “fair” price, then share is considered undervalued and long position is opened in order to achieve a “fair” price.
Analysis of reporting is applied not only on the stock market. For each group of financial assets there are own periodic reports which in greater or lesser extent affect the ratio of supply and demand, and hence the price. For example, the mandatory traders’ report COT (Commitments of traders report) which is published by the Commodity Futures Trading Commission (CFTC) on a weekly basis can be distinguished for the commodity futures market. The volumes and direction of opened positions of different market participants are presented in these reports. Market participants are represented by three large groups:
- Small speculators
- Hedgers
- Large speculators
Analyzing the total position of these three groups of participants, we can draw conclusions about the general mood of traders relatively to the selected asset. Herewith, small speculators as the most uninformative group of participants is often made mistakes in the direction of its own forecast. Hedgers pursue their goals, and namely are defended from potential losses upon delivery of the physical commodity, the actions of this group of traders are ambiguous, and they are the most informed market participants by virtue of their specialization and direct access to the information of producers. Large speculators are trying to earn money on the actions of hedgers. The ratio of opened positions of these three major groups of traders can be used to forecast the future prices. Do not forget that the published data is out with a delay of almost a week. Dynamics ratio of opened positions since time of the last data collection is unknown to us.
There are plenty of periodic reports affecting the price dynamics of one or another asset. The most correct, in my opinion, is the plotting of multifactorial price formation model which would have included all main non-pricing data by selected asset. Having created such a model, the trader will deeply understand all the factors affecting the price and can predict with high probability the dynamics of asset prices. In this case, the methods of technical analysis will play a role of “trigger” when opening the position in the direction of fundamental analysis.
Have not tried PTMC yet? There is no better way to boost knowledge than to use it! Start trading with PTMC now!

