

Historical data analysis in Protrader
Hey there, Protraders!
By creating a trading system based on the methods of technical analysis, or by checking the signals of fundamental model on workability, the trader always works with historical price and non-price data. Analysis of the historical data is associated with a lot of difficulties. First of all, it is a problem of historical data quality. Agree that very few people would like to find a "profitable" pattern, create a trading system based on it, run this system on the forward test and get a systematic reduction of the funds on the trading account. And all due to low quality of the historical data. Low quality can lead not only to a distortion of the test statistical indicators of the trading strategies, but also to the finding of non-existent dependencies with all its consequences. Thus, the selection of historical data that will be used when creating and testing the trading strategies is an important moment of the trader’s work.
Qualitative historical data, where are you?
To get qualitative quotes in demo mode or from free sources is almost impossible, they will abound in non-existent “gaps”, “studs” and other “pleasant” surprises, and also the historical "depth" of the available data in this case leaves much to be desired. You can collect interesting data in the real-time mode by creating your own database. How much time will pass until the representativeness of collected data will allow testing the trading strategies? Taking into account the difficulties written above, the best way to solve the problem of the quality of historical data, on my opinion, is to connect to the specialized services that offer qualitative price and non-price data. But for beginners this solution is often not available and unjustified from a financial point of view. In this case, manual or semi-automatic checking of historical data and correction of obvious errors is the only way which remains. This can be done by the cross comparison of several data sources. Of course, there is no guarantee that we can trust to all used data sources and the resulting “bonding”. But this is better than testing on the wittingly “leaky” quotes. This method will be more effective for the exchange instruments since there is a centralized original source of prices. For the instruments with off-exchange model of price formation, the creation of qualitative database is more complicated task. The quality problem of historical data is particularly acute facing the traders who practicing high-frequency trading methods, as even small deviations of the historical prices from the reality, can significantly distort the testing scores of the trading system.
Know your market
When working with historical data, however, as elsewhere in the trading, we should consider the specifics of selected tool. Thus, for the stock market especially when testing the portfolio strategies, we should take into account a list of stocks which have been excluded from trading on the stock exchange (Delisted Stocks). Since the accounting of non-tradable equities can lead to the receipt of unreliable testing indicators. When trading with Futures, the most correct variant will be to use historical data of individual contracts. For example, not every tester can take into account a specific moment in futures trading, such as the transfer of positions before the expiration to the next contract. In practice, this problem is often solved by simplifying the historical data for Futures; this method implicates the combination of all contracts to a single continuous array of quotes by a particular algorithm of the transition from contract to contract. Continuous "bonding" obtained as a result may include non-existent in reality quotes and "gaps" at the junction of contracts. In this case the trading signals arising in the last days of the contract can be incorrectly assessed. Trading system statistics which can take into consideration “gaps” as an additional profit or loss can be also distorted. Seasonal effects arising not on the nearest contract are impossible to assess on the “bounding”. Described problems with the “bounding” are the most pronounced on the commodity market where the difference between the prices of neighbor futures contracts can be quite substantial.
Year or ten years?
Another serious problem of historical data for creation and testing of the trading strategies is the “depth” selection of used prices. On the one hand, the nearest historical data is the most relevant and describes the current nature of the market, on the other hand, the accounting of more “old” data will provide more information about the behavior of the trading strategy in different market conditions. Trading nature of one or another instrument usually has a periodic character, i.e. periods of rapid growth in prices are followed by periods of low trading activity or a significant drop in the asset prices. These impulses and corrections are observed not only on short-term charts; the large cycles with duration from several years to tens of years also exist. Long-term cycles are stipulated by global economic factors that directly affect the composition and actions of market participants. When developing and testing the trading systems, on my opinion, it is necessary to use historical data that include all cycles described above. So trader can assess the performance of the trading system in different market conditions and be prepared (as possible) to the change of the market cycle. If it wouldn't made, then there is a high probability that you obtain “adjusted” trading system, the behavior of which when changing the market cycle will be unpredictable and can lead to the loss of funds. Let’s consider a simple example: since the first half of 2009, American stock index S&P 500 is in a bullish trend, but shouldn't be forgotten that earlier the periods of long growth alternated with shorter periods of rapid price drop. The chart of S&P 500 day close prices since 2000 is shown below.
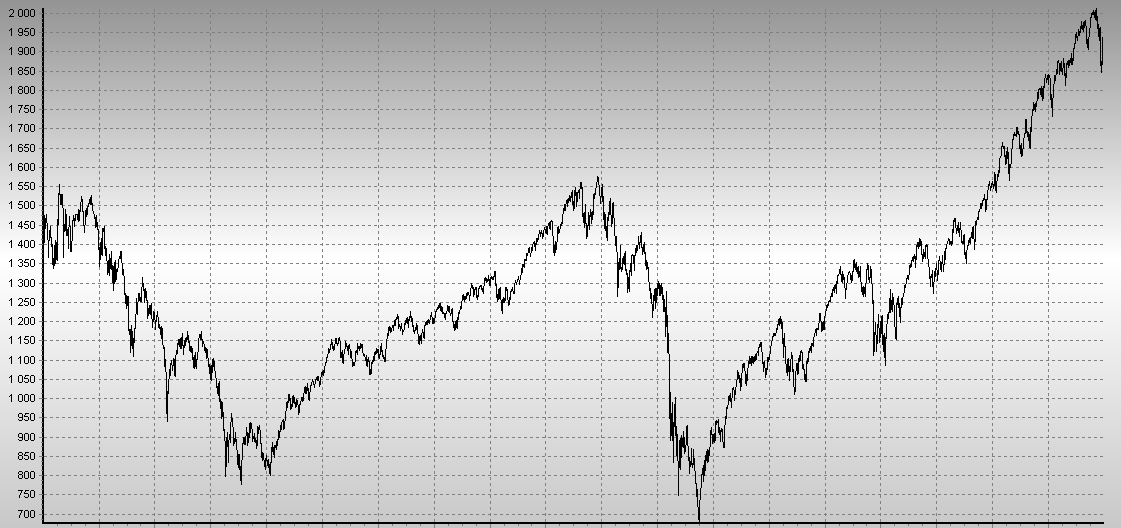
If the trading strategy will be created and tested on historical data of the current bullish market, then there is a high probability of a simple “adjustment” under the bullish trend. Characteristics of the system outside of long bullish trend are unknown; this can lead to large losses when changing the market cycle. Of course, the trading strategy does not have to be symmetrical (to have comparable results of the trading in bullish and bearish market). For the strategies oriented on a certain market type, it is necessary to provide the filters, which would exclude opening of the positions outside of target type of the market. Nevertheless, do not overdo it, those areas of the historical data on which the composition of the trading participants or the fundamental background is radically different from the current market, should not be included in the test sampling. Such filtering of the history can only be done in the case if are no preconditions to the repetition of similar market situation. These recommendations are largely related to intraday or longer-term trading strategies. High-frequency traders are less sensitive to the macro state of the instrument, since they mainly use the peculiarities of market microstructure.
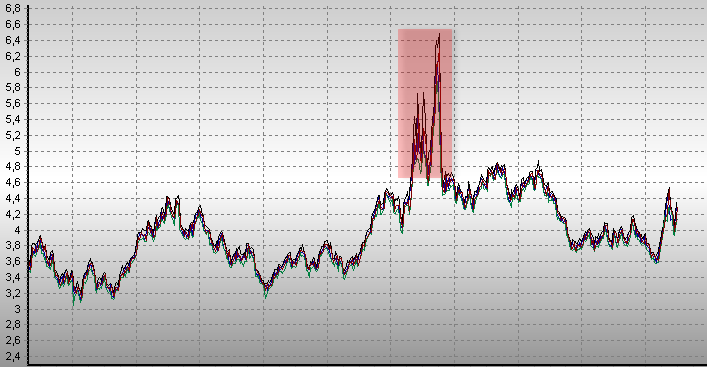
As an illustration, we can consider an example of the periods of extreme volatility in the prices of natural gas. Having considered the historical gas prices over the past 3 years we can distinguish a surge in volatility, which is completely out of the general trend. It is highlighted with a red rectangle. There is a temptation simply not to include these anomalous prices in the test sampling. Nevertheless, trying to determine the reasons of this phenomenon, we learn that this price growth is stipulated by very low temperatures during the heating season. All the rest of the time as represented in the chart, weather anomalies of this magnitude were not observed, hence the relatively low volatility.
Obtained information makes us to take a look of the history more deeply, and check, have there been similar situations before? Whether such behavior is characteristical for the gas or is it an isolated incident? Below is a chart of natural gas prices for the period since 2008. Splash of volatility during the cold winter is clearly visible on a comparable scale.
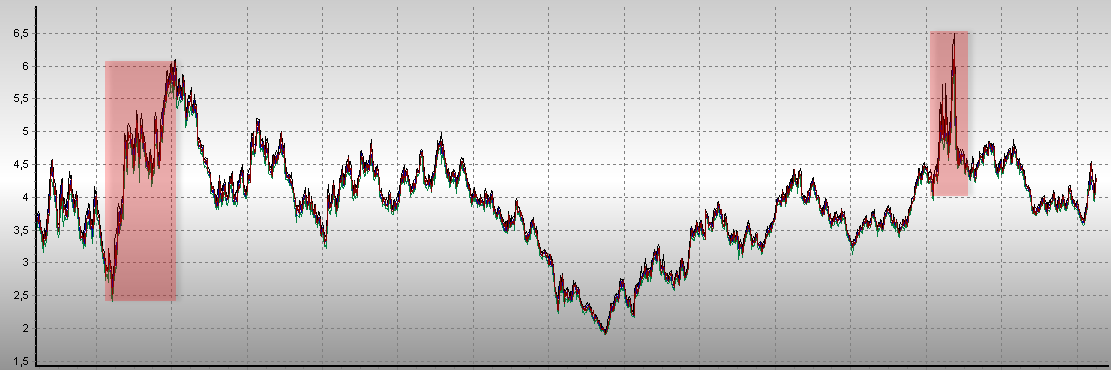
It becomes clear that this effect appears periodically on the instrument and, as a result of abnormally low temperatures, it can happen again. This fact should be considered when developing trading strategy on this instrument.
Hour there - an hour ago...
If trading strategy uses market dependencies, which clearly depend on astronomical time, then particular attention should be paid to the time synchronization of historical data. Effects associated with opening/closing of trading platforms, the release of important periodic reports, etc. can be an example of such dependencies. For example, with the transition to winter/summer time, can occur the problems with testing the strategies that are closely tied to the time of the trading signal appearance. Testing of the influence of the periodic reports’ release on asset prices can serve as another example. If during the period of testing the periodicity of reporting was changed or the time of data release was postponed, then this should be considered in the logic of the trading strategy. Otherwise, the test results will not correspond to the actual situation that may result in deficiency or loss of money.
Have not tried PTMC yet? There is no better way to boost knowledge than to use it! Start trading with PTMC now!

