

Protrader. Trade patterns
Hey there, Protraders!
Each trading system is based on trading idea which is characterized by some statistical advantage. Trading idea is based on a certain stable, periodic dependence of price and non-price data.
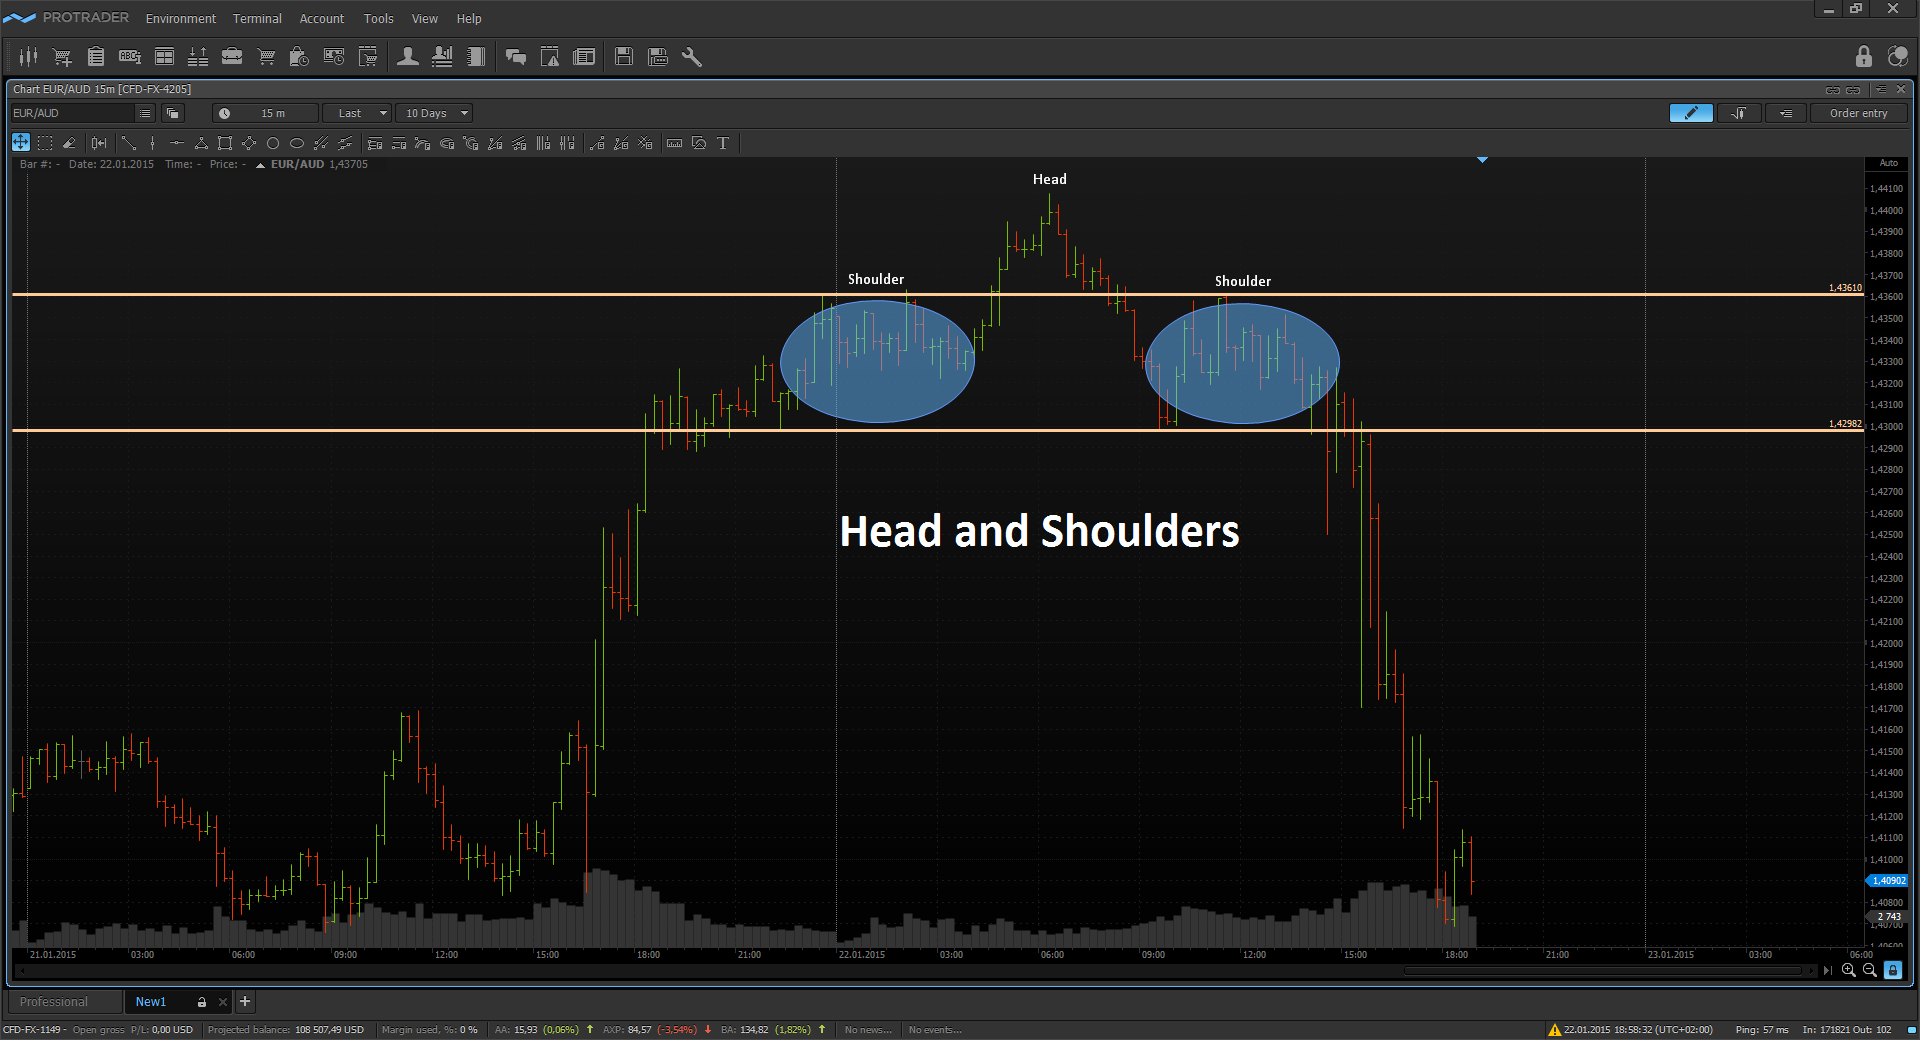
Dependence, on which we can earn, should give a possibility to predict with a certain part of probability the subsequent price movement. For example, a trader has noticed that after the pulsed asset movement on the European session, the probability to continue the movement on the American session is about 70%. Based on this observation, we can formulate the idea of trading: trading in the direction of pulsed movement that was generated on the European trading session. Herewith, the definition of the pulsed movement is clearly formalized by several parameters, such as time of the impulse formation and its absolute value. Such dependencies are often called as patterns. Under pattern I will mean the recognizable sequence of some price or non-price data which has a predictive power. Patterns can be of different nature, for example, the well-known graphic patterns, such as head and shoulders or double tops can be observed on the price chart of any financial instrument. From the viewpoint of volatility, the growth of trading activity at the moment of major platforms’ opening or important news release can be called as pattern. Anyhow, activity of the real market participants provoked by various reasons stands up for any pattern. Ideally, trader should understand why found dependence works, what market processes stand behind its formation. This knowledge will provide an opportunity to understand the conditions under which found dependence may disappear and bring significant losses.
If a pattern is found, the question about its robustness or stability arises. Search or checking of the robustness of already found patterns, anyhow, is reduced to the testing on historical data. Stable pattern must have analogous statistical indicators on a fairly large sample of historical data, but if not, it's worth performing a separate research to determine the causes of such behavior. In other words, if trading at the breakthrough of range of the first trading hour over the last year gives 80% of profitable trades, and last year the figure was 40%, then you should figure out the causes of such situation and think about risks when trading with real money on the basis of this pattern.
Today, almost every trading terminal has powerful built-in tools for testing and optimizing the trading strategies, “Protrader” terminal and “AlgoStudio” are not the exceptions. Having such a powerful toolset, traders often pass the whole job of building a trading system on to optimization algorithms. It happens like this: some trading idea appears, for example, trading on the intersection of Moving Average at a certain time, the strategy code is created, herewith all that is possible are taken out into the optimization parameters, and the benefit is that powerful computers and built-in optimization algorithms allow processing major array of data in short terms. Search for the optimal pattern parameters is performed, and since the system has a huge number of freedom degrees (optimized parameters), then it is easy enough for the optimization algorithm to find such a combination of settings which would best adjust to historical price data on which the optimization is performed. At first glance, the way it should be, and it's an easy way to create a profitable trading strategy, but in reality it is self-deception. System with large number of settings is simply “adjusted” under historical data, and in most cases shows disappointing results on the walk forward test. This is a problem of excessive optimization. How to avoid it? First of all, trading idea and all subsequent filters of the trading system should be tested separately in order to avoid the effect of “adjustment”. Each system element and its parameters should be caused by real market processes, the trader should understand why it works and under what conditions this effect may disappear.
A sign of real market inefficiency is the stability of the trading system results with respect to its parameters and the period of historical data, on which the testing is held. If you build a dependence of any resultant system indicator, such as the profitability, from several input parameters, for example, period of Moving average and its type, then the presence of a relatively large area of profitable combinations of the system settings around the optimum point will be typical for sustainable pattern. Sometimes, we can even observe a relatively uniform surface for optimal settings under which the pattern shows good results. This means that pattern weakly depends on thin setting of its variables, and remains profitable on the wide range of its parameters. To illustrate the principle described above, let’s consider the following example. Suppose a trader knows that the stock price of some company will grow over half a year. As a signal to entry a long position, trader can choose the simplest signal of the beginning of an upward movement, for example, the breakthrough of the moving average. In this case, the result of its trading will not significantly depend on the parameters of the selected moving average.Provided the authenticity of the obtained bullish forecast, the trader will profit by selling the exponential moving average with a period of 10, or simple moving average with period 50.
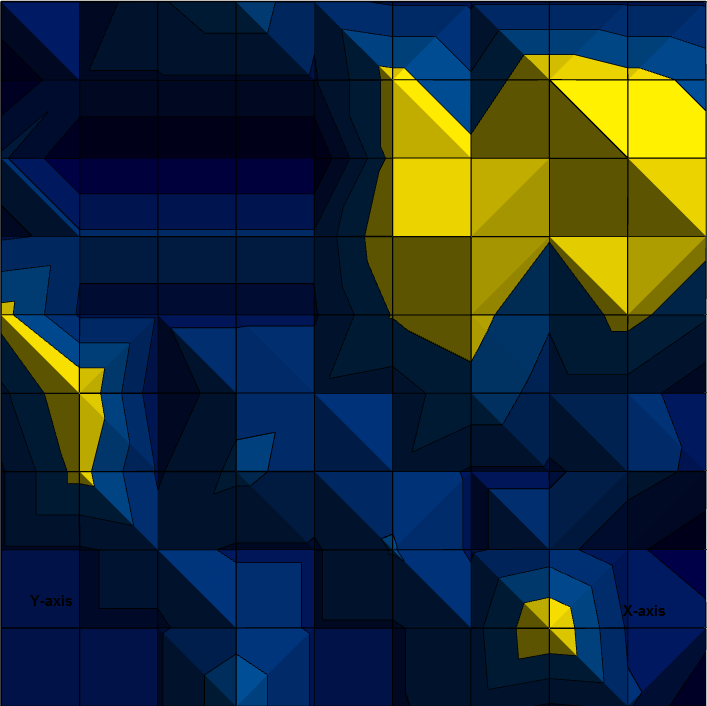
If found pattern is stable, then changing of market cycle is not likely to lead to a sharp deterioration of the system performance. How to distinguish adjustment from the real stable dependence? If during the optimization, the profitable settings which have the appearance of a single peak on the surface of the system parameters were found, then, it is likely that received system settings are "adjusted" and do not have the stability. As an example, let’s consider the dependence of some pattern’s profitability of its two main parameters (by axes X and Y) below, more profitable parts of the surface parameters are shown in yellow, less profitable – in blue.

An arrangement nature of profitable sets of the system settings on the solutions surface is random and has a view of individual peaks. With the small change in the values of these parameters, the profitability of the trading system will significantly drop. If there is no objective explanation for individual peaks of profitable system settings, then, it is most likely, this is a result of “adjustment” under historical data.
Below is the chart of profitability, in my opinion, of more robust pattern:
As before, optimized parameters of the pattern are shown by axes X and Y, the profitability – in color. Yellow color corresponds to high values of profitability. The whole cluster of profitable parameters can be observed on the right top corner of the chart. I.e. when changing the settings over a wide range, the pattern remains profitable – it is a sigh of stability. For the most stable patterns, such dependencies are of the form a smooth parabola, when the resultant indicator gradually falls from the optimum point.
The construction of such multidimensional dependencies is easily implemented, since the majority of trading terminals supports the ability to export the optimization results to the various external applications, for example, Excel spreadsheets. Implementation in Protrader looks as follows: after holding the optimization in AlgoStudio, evoke the context menu in the results table, then choose “Export” - > “To Excel…”.
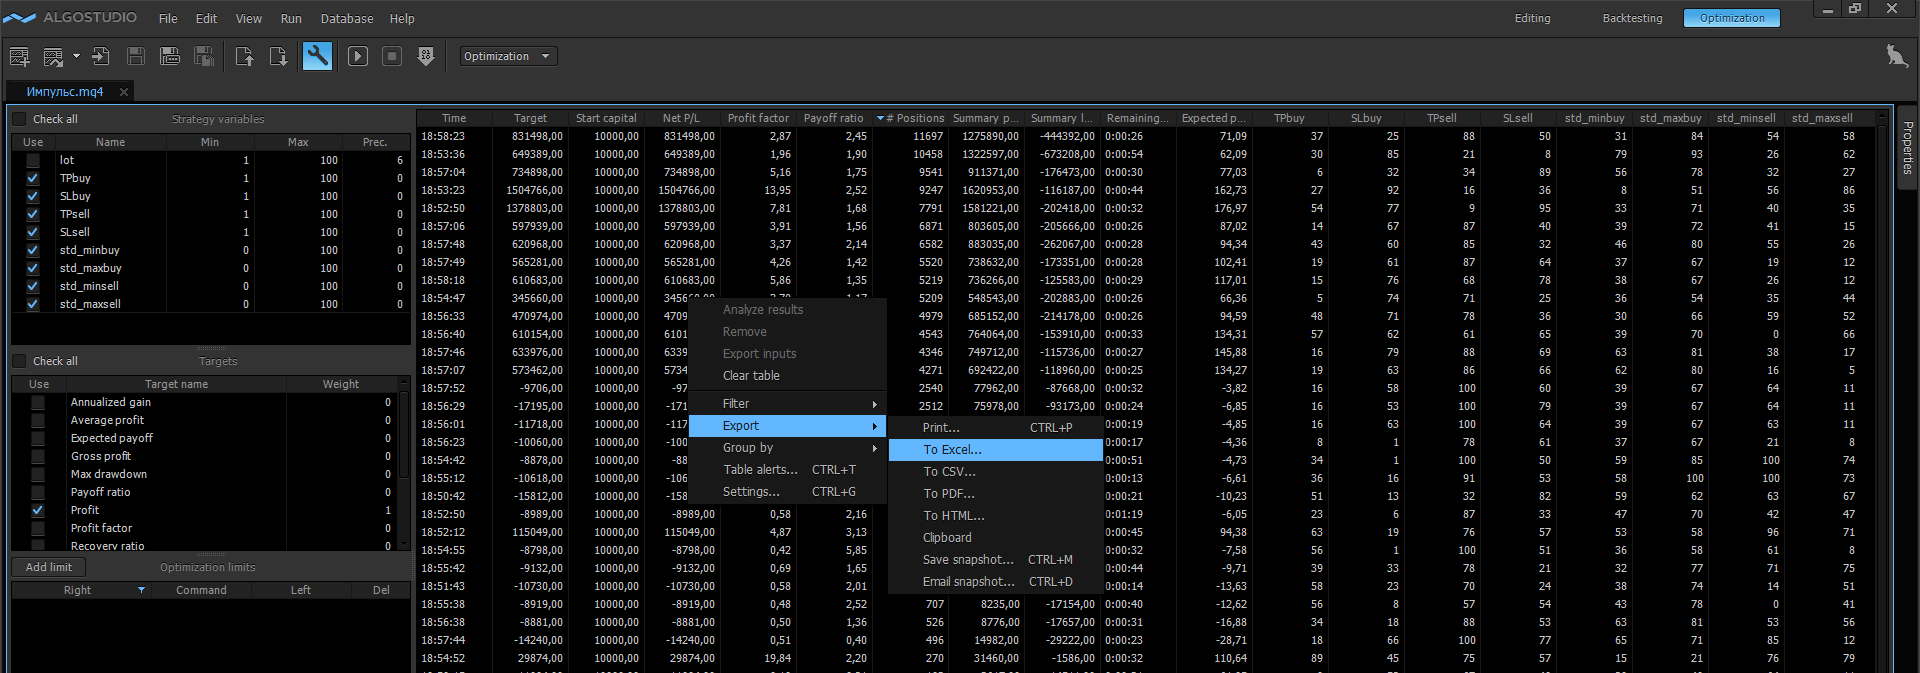
Next, select the exported optimization parameters and you get a spreadsheet, by values of which we can build the dependencies which are interested for us.
Along with shown above signs of the pattern stability, it is desirable to have similar smooth dependencies of the resultant pattern indicators from the period of testing. To check this condition we can hold the “ Walk forward” test or optimization on several history parts of the cross-validation type. Choosing the optimal sets of the system settings on each pass, and building their dependence on the part of historical data.
In my opinion, with the presence of described above signs, found patterns can be considered stable. Trading systems built on such dependencies are more robust than the trading systems created by optimization of the large amount of settings without additional analysis.
Have not tried PTMC yet? There is no better way to boost knowledge than to use it! Start trading with PTMC now!

