

Volatility analysis of the price series
Hey there, Protraders!
Certainly, most traders have heard about such a notion as “volatile market” or “volatility”. This term is used in almost all technical and fundamental reviews of the various markets (Forex, stocks, and commodities markets), a lot of research papers has written on the subject of analysis and "predictions" of volatility. In this article we'll get acquainted with this notion closer, consider its types, and also basic indicators which allow measuring the current level of volatility of the price series.
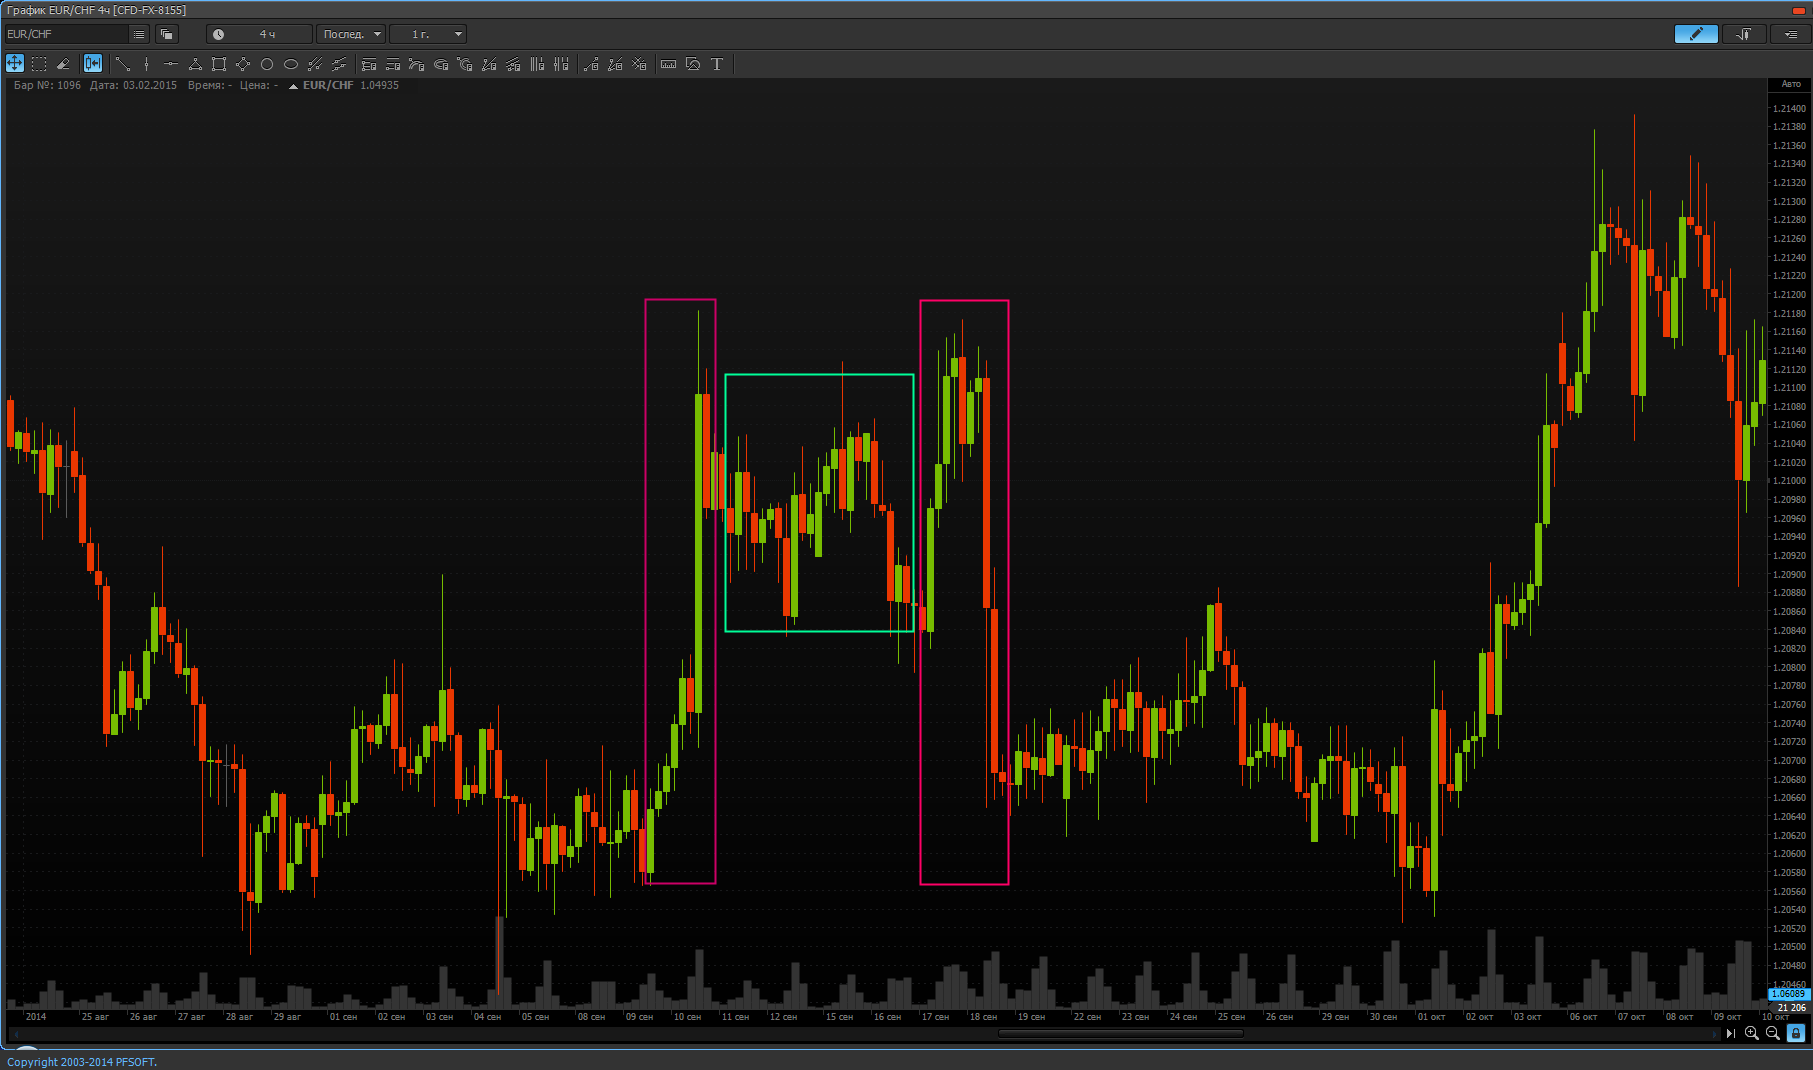
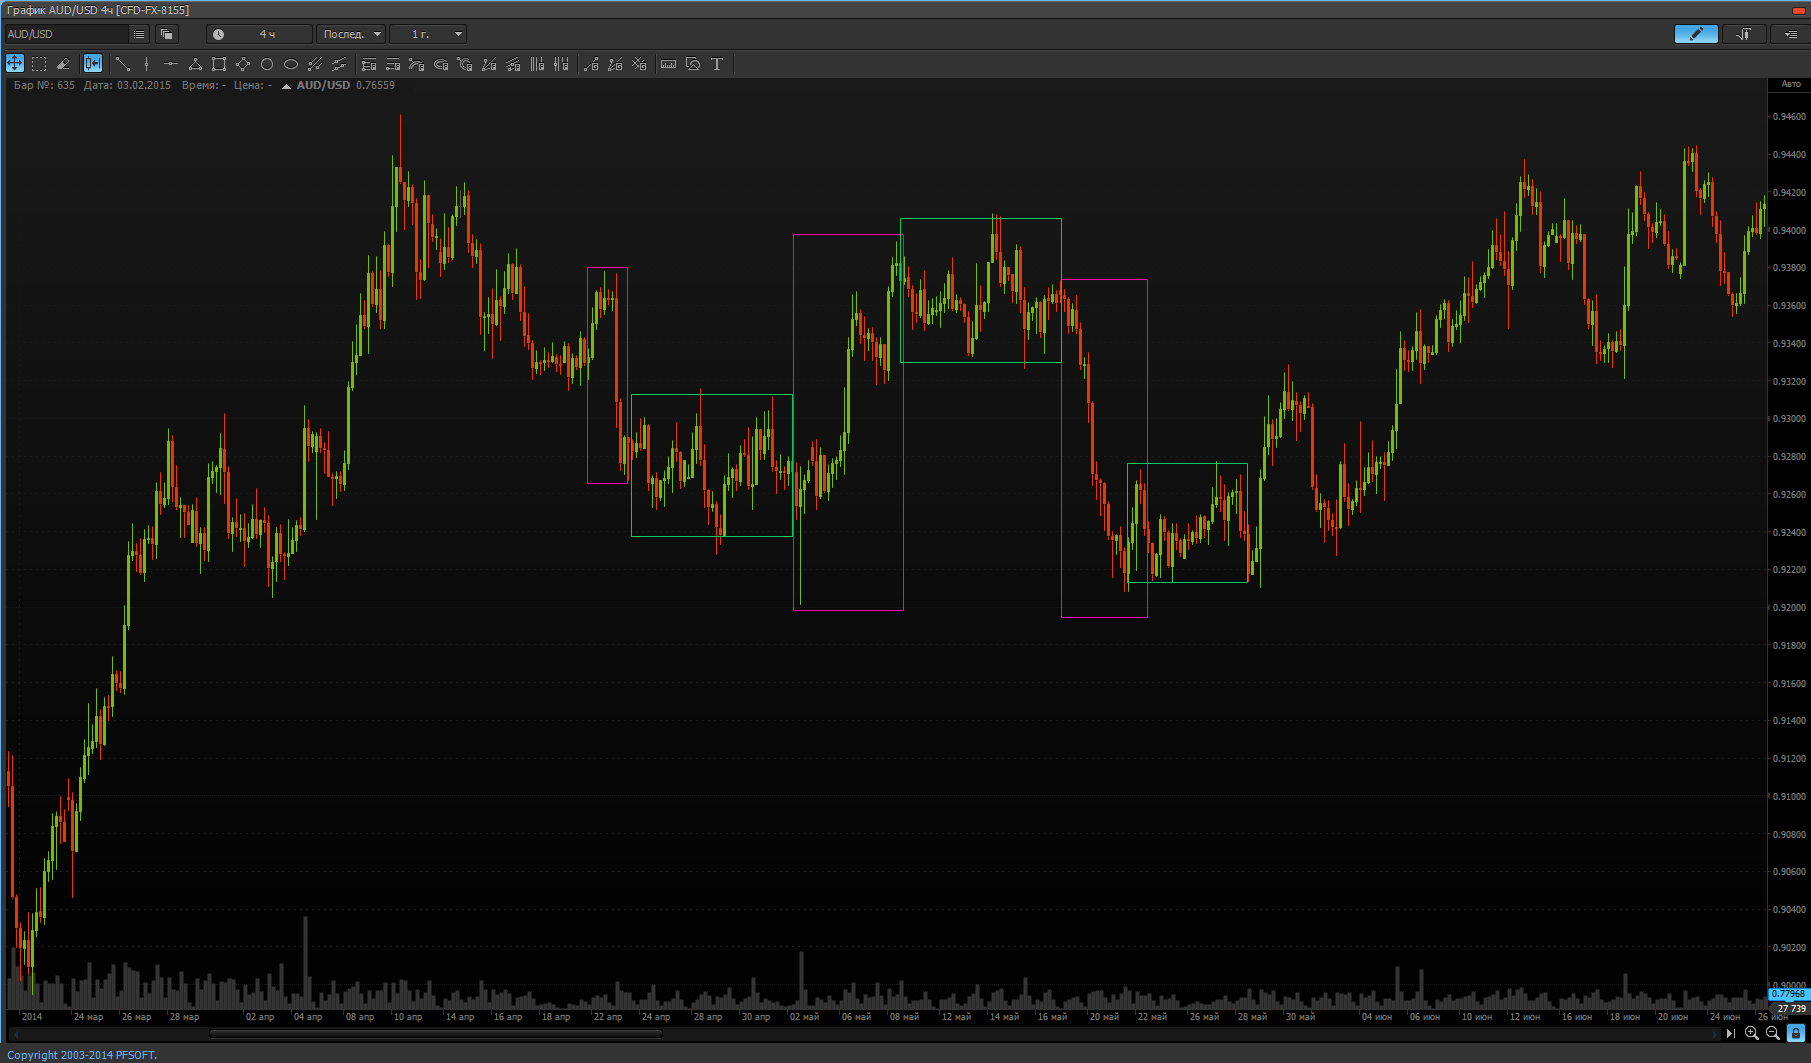
Let's start in order, that is, with a definition. Volatility – is a statistical measure that characterizes the price variability of the traded instrument. This is a fairly simple definition at first glance, hides behind itself a lot of mathematical and statistical nuances. Several charts are presented as an example, on which periods of high and low price volatility are marked with red (high) and green (low volatility).
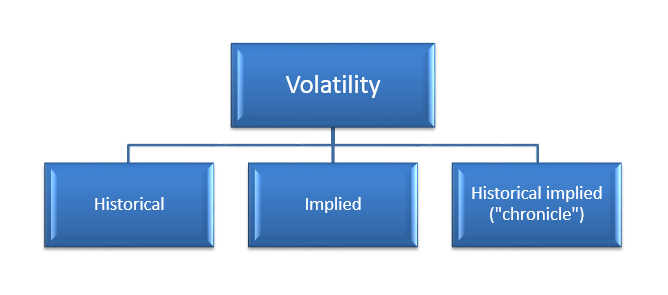
There are several types of volatility:
- Historical volatility is calculated on the base of historical price data, i.e. reflects information about past character of the asset movement. This type of volatility includes a wide range of technical indicators, which will be discussed below.
- Implied volatility (or "expected" or "imputed") is calculated on the base of the prices of derivatives (options). In fact, this type reflects future price deviations or expected risks.
- Historical implied volatility – is a history of predictions for expected volatility which often averaged for 30, 60, 90, 180 days.
The concept of historical volatility
In the classic sense, the historical volatility is determined by the following formula:
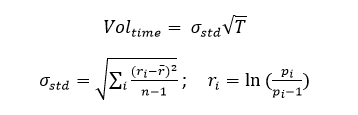
where:
 – standard deviation of the asset prices, i.e. measure of the sweeping movement;
 – price of the i-th value (here can be one of the four bar prices);
 – bringing the volatility indicator to the specified period (most often to the annual value).
Generally, the standard deviation is calculated either in absolute values, i.e. in the prices of the specific asset, or relative (%). The value of volatility allows assessing the riskiness of the asset based on the different factors:
- Liquidity – the lower the asset liquidity, the higher the volatility, since the amount of people willing to buy or sell the asset is less. For example: if to consider the commodity market, then orange juice is much more volatile than the market for cotton. I.e. this instrument is subjected to a sharp surge in prices. If to consider the equities, then less liquid equities are also prone to such outbursts, because a major player that comes again can effortlessly "inflate" the prices.
- The release of important reports – usually the volatility is sharply increased after the release of important reports, such as, change of the Fed interest rate, the change in the unemployment rate, quarterly reports about company’s profits, as well as data on oil and other.
- The economic situation in a particular country – the higher the uncertainty in the political and economic life of the country, the more risky the investments will be.
The main technical indicators of the volatility
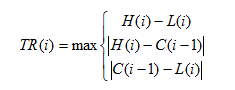
Quite often, the market uses the phrases "intraday volatility of the asset" or "within the daily volatility". I.e. is intuitive, that is meant the change or scatter of the trading price range on some value during the day. ATR (Average true range) is one of such technical indicators that can show the scatter in prices. The basis for calculating the ATR is the averaging of the price range for the last n periods for a maximum of three criteria:
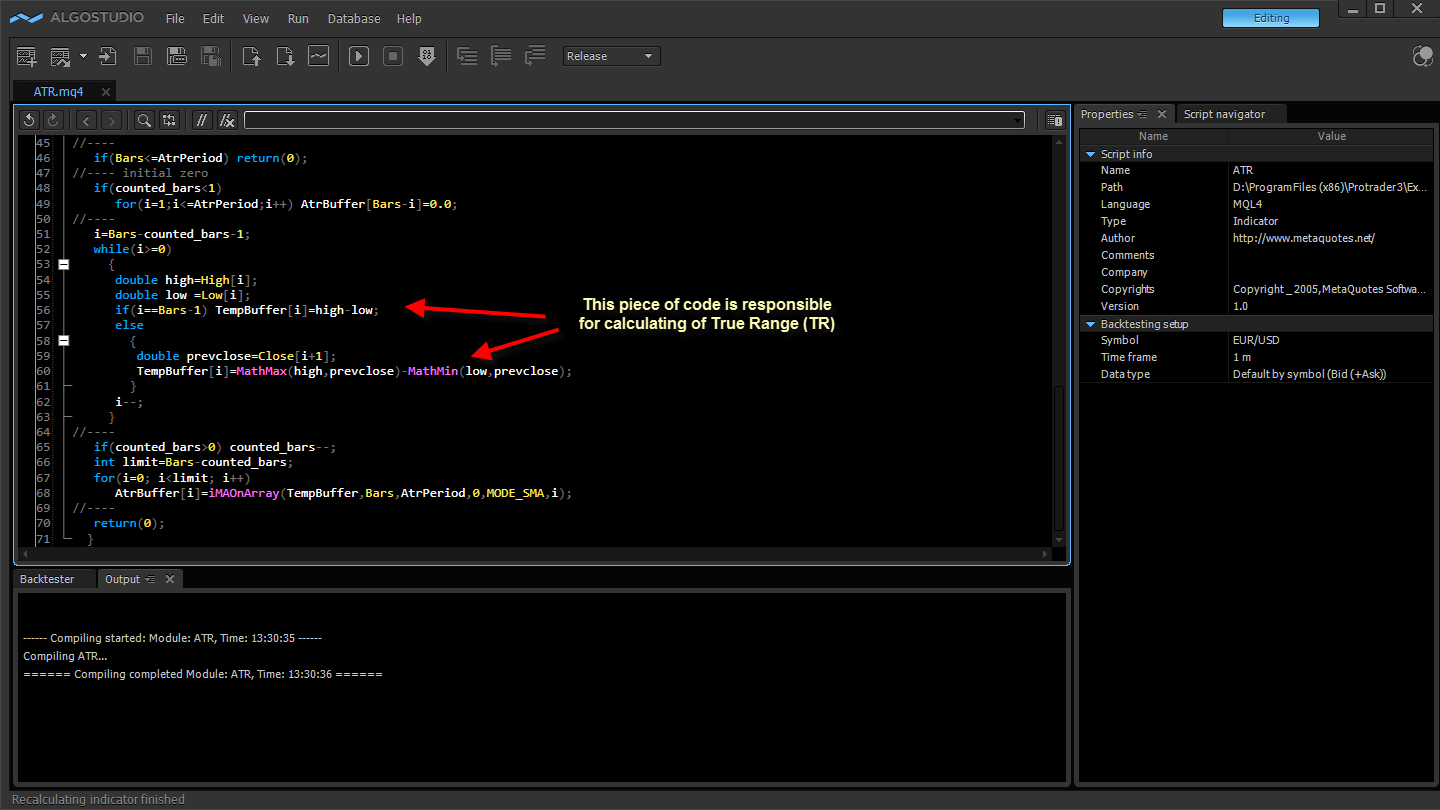
The averaging of the obtained values by default in the “Protrader” terminal is set into 14 (depending on the used time frame), herewith the user can choose the period, as well as the method of averaging (simple, exponential, linear weighted and etc.)
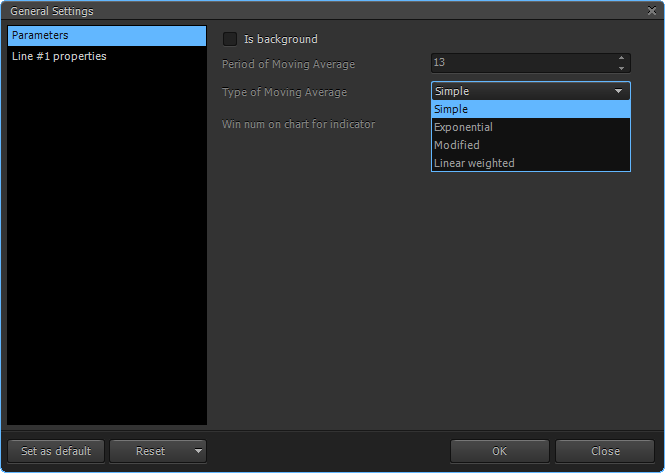
After setting all the parameters, the task for the trader is to use indicators in the trading system. It should be noted that this indicator does not allow predicting the future course of prices, but it gives a benchmark for setting the level of take-profit and stop-loss.
For example, let’s set the period of indicator in “5” on the day chart. It is easy to note, the change of the cyclicity of the underlier price, on the basis of which we can conclude about return to the average value, and also set some limits of the price scatter within the selected period (month, quarter, year, etc.).
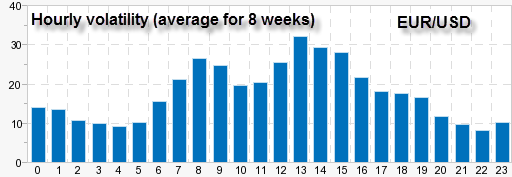
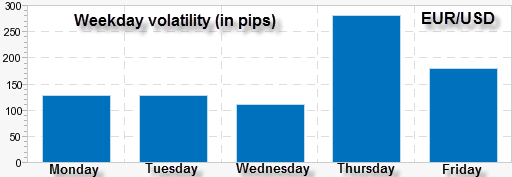
If we hold the analysis of the series by days of the week, then we can identify the most active days, where the sweep of the movement is wider than in other days. The same rule can be applied to the analysis of the series intraday by defining the most volatile hours of the trading.
Another indicator of the volatility analysis is Bollinger Bands which is represented in the form of three moving average lines. The central line is typical moving average (type is chosen by the user; by default the simple type of smoothing is set). The other two lines are the same moving averages, but remote from the central on N standard deviations.
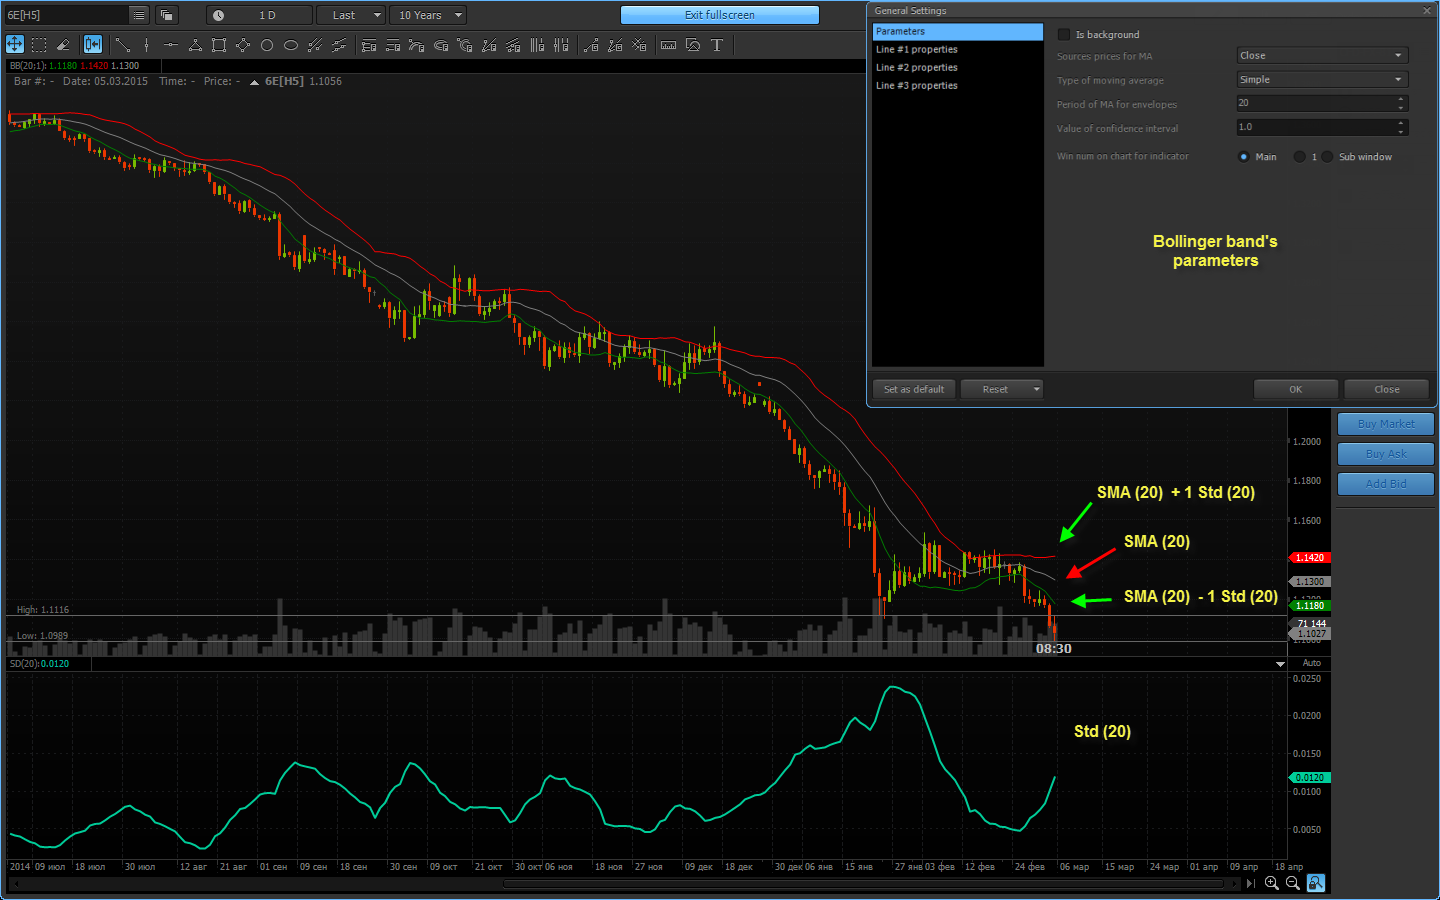
Every trader individually selects the parameters for each instrument, th e time frame, as well as own style of the trading. As for the volatility, the signal of this indicator is quite simple – the smaller the width of the channel, the lower the volatility. In order to understand how narrow the channel is, it is necessary to check on the historical data the average width of the channel for the quarter, year, to assess the average length of the trend after breaking through this channel. As an example, this indicator can be used for the breakdown systems of exit from the flat, or vice versa, for return to the average moving.
The concept of the implied volatility
The next type of volatility – "implied" or "expected", reflects the mood of the participants to the possible asset movement in near time (usually on the lifetime of the option contract). As already mentioned, this type is used for the assessment of the derivatives (options).
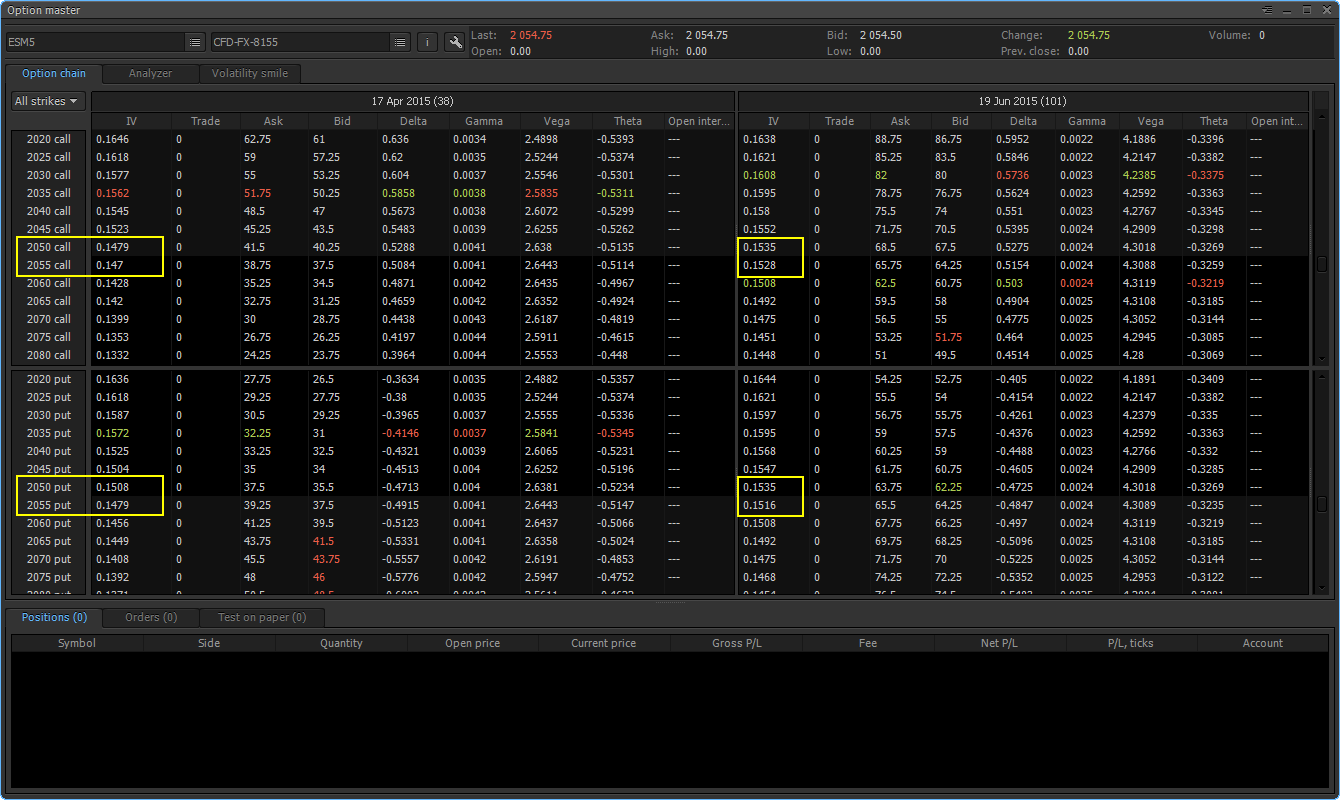
For example: the option desk on Futures E-mini S&P500 from the “Protrader” terminal is presented below. The nearest strikes to the current price of the futures (2054.75) and current values of the volatility for these strikes are marked as yellow rectangles. Substituting these values into the Black-Scholes formula (you can use other models), we obtain the current option prices. Currently, the area of research for finding the implied volatility and search of a better option pricing model has become very popular in the quantitative finance.
Professional option traders often talk about option prices in terms of volatility, since the portfolio can be often hedged (the so-called delta-neutral strategy), that is why it is very important. Typically, such traders trade the volatility change, herewith the change in the underlier prices is virtually ignored. For example, the cost of XYZ is $110, Call option price is $2.5, and the implied volatility is 22%. After some time, the equity price grew to $113, the option also increased in the price to $3.1, and the volatility decreased to 19%. Despite the fact that the option in the second case rose in price, for the delta-neutral portfolio is more important that volatility has decreased.
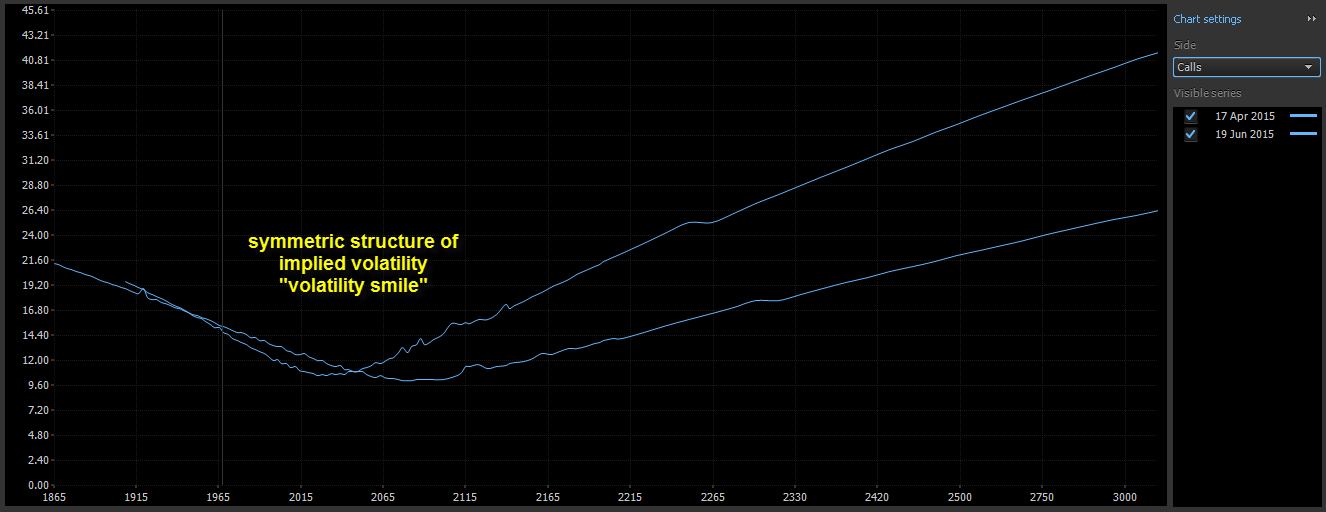
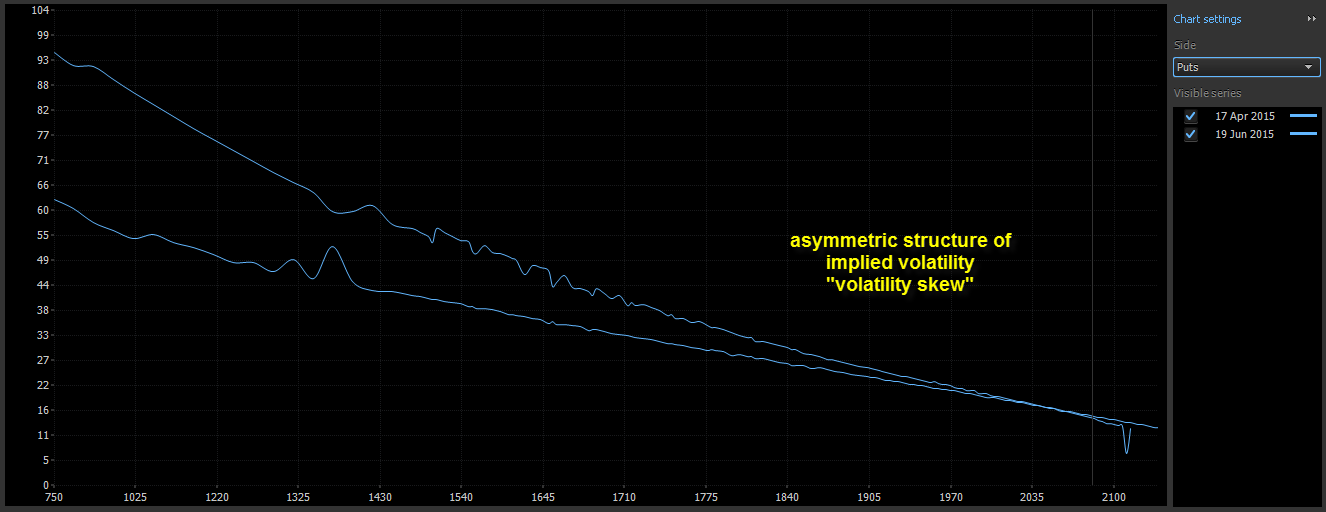
The concept of “volatility smile” is often used in the option trading, which is calculated for all options of the specific series for one underlier. It is believed that if there is a volatility skew to one of the option sides (Call or Put), the participants assess this side as riskier. For example, two charts of volatility, separately for Call-options and for Put-options are presented below. Asymmetry of the volatility tails on Put options is clearly visible, i.e., it is higher than on Call options. Such an effect on indices and equities market is associated with the fear of a strong collapse; therefore, many equities traders stand in long positions, and hedge the risks using Put options.
To summarize, it is important to note the joint use of all volatility types, since major players (banks, hedge funds, institutional investors) often work simultaneously on the spot market and on the options market. For them, the volatility is the same asset, as any stock or futures.
Have not tried PTMC yet? There is no better way to boost knowledge than to use it! Start trading with PTMC now!

