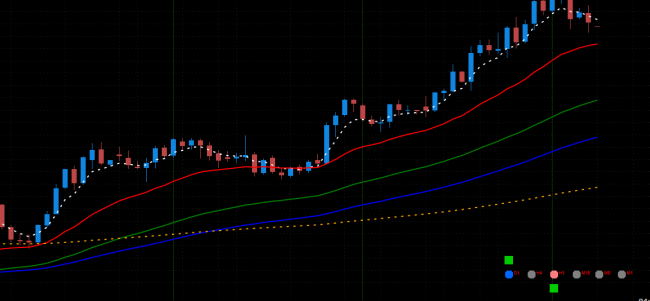
Simple Fan Indicator
A steroid indicator from the series to grasp as much charts as possible. What it does? It shows multiple trend from the current chart by following EMA lines (up to 9) as well as with extra timeframes (up to 9), which trader can set manually. So all in all it is potentially up to 81 EMAs are ready to perform their best, which is to assist with trend signals. For the sake of user, an additional display is available in the lower screen with dots, time frame labels and squares. Simple but effective rules: red dots are signaling a downtrend at specific time frame with all the MAs from highest to lowest to be ranked in descending order, blue is vice versa ranked in ascending order and gray is when EMAs are in the mess. The square which is above or below dots are additional signal to show current price is lower or higher from lowest period EMA. Simple Fan is one tool you would really need to be running in the background to have a definite grasp on favorite instrument.

 09.08.2017
 177
177


