You need to enable JavaScript in order to visit our site!
 
Logo PTMC
NAVIGATION
CANCEL
 
or via PTMC account
Restore password
or via PTMC account
Logo PTMC
NAVIGATION
or via PTMC account
Restore password
or via PTMC account
or via PTMC account
Restore password
or via PTMC account
Burhay Vlad Burhay Vlad 07.06.2017

Swamicharts Indicator

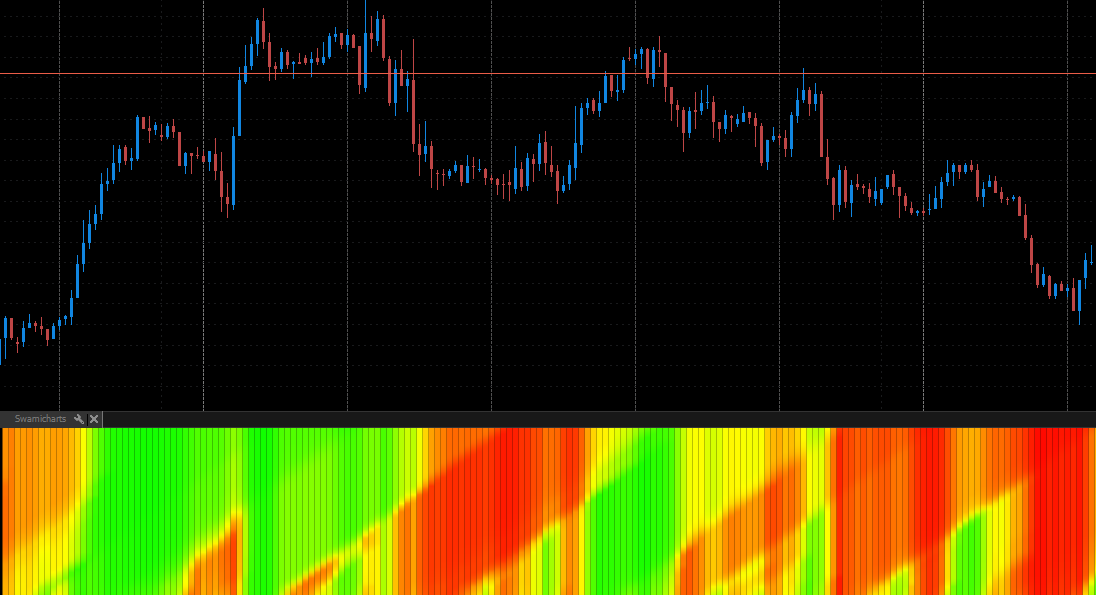
The SwamiCharts is a classic interpretation of stochastics indicator introduced by John Ehlers and Ric Way. A wonder tool, with stuffed visualization effects, demonstrates a method of producing heatmaps from collection of common indicators. A range of stochastic values with different periods is adjusted along with one single bar, by a generating a color gradient for each of them. This way it is easy to determine, whether it is good time to sell (red area),buy (lime-green area) or stay away from trading (yellow shades). Go on, try it on!

Files
07.06.2017 59
Discussion
Join PTMC community to post your comments
No comments yet. Be the first.
PTMC is a professional trading platform that combines all the best charting and analytical tools to trade on different financial markets. It is developed by PFSOFT UK LTD, a global provider of trading technology for banks & brokers
© 2024. PTMC is based on Protrader technology
PFSOFT UK LTD
71-75, Shelton Street,
Covent Garden,
London, WC2H9SQ,
United Kingdom
Support & Development
PFSOFT Ukraine
Office #701
Mechnikova Street, 10B
49000, Dnipro, Ukraine
Contact us
Phone: +380 56 740 30 01
E-mail: info@protrader.org
Skype: PTMC_support
Find more ways to contact
Join us in social networks