ReportViewer plug-in
The RV (ReportViewer) is very useful and absolutely free plug-in for PTMC platform which can help traders to get more additional information about COT for futures. The source for that info is U.S. Commodity Futures Trading Commission and their weekly “Legacy” reports.
If you don’t know “What is…” and “How to use…” COT reports, we have a great article “How to use COT reports to trade market?” which will give you answers about COT.
The main idea of ReportViewer is to facilitate process loading, saving, standardization and reading legacy reports by selected asset. This plug-in can present data not only in a table form but also in a graphical.
Adding instrument:
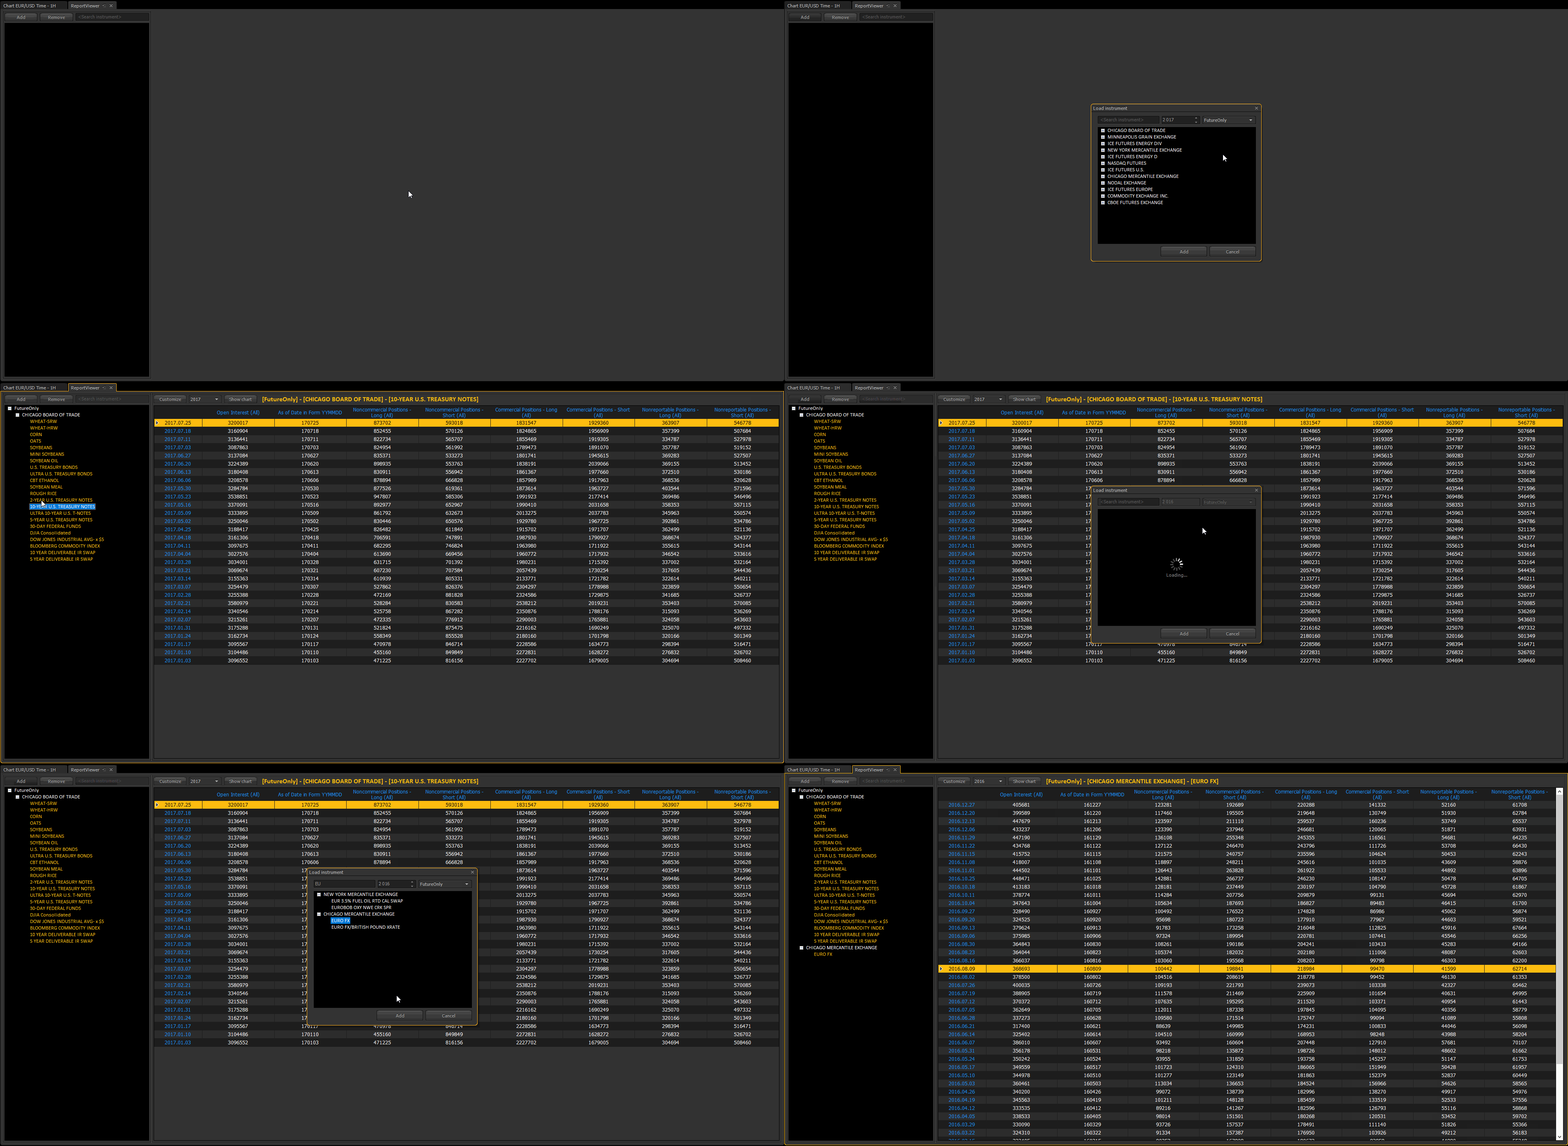
To add instruments, please click “Add” button in the upper left corner. A “Load instrument” window will appear and show the list of available exchanges and instruments from selected report. The loading process is automatic and works with a delay of 2 seconds after changing report parameters (year and type of report). After loading, you can choose only one instrument or the whole assets list in the selected exchange.
Removing instrument:
To remove selected instrument/exchange/type click “Remove” button.
Changing table:
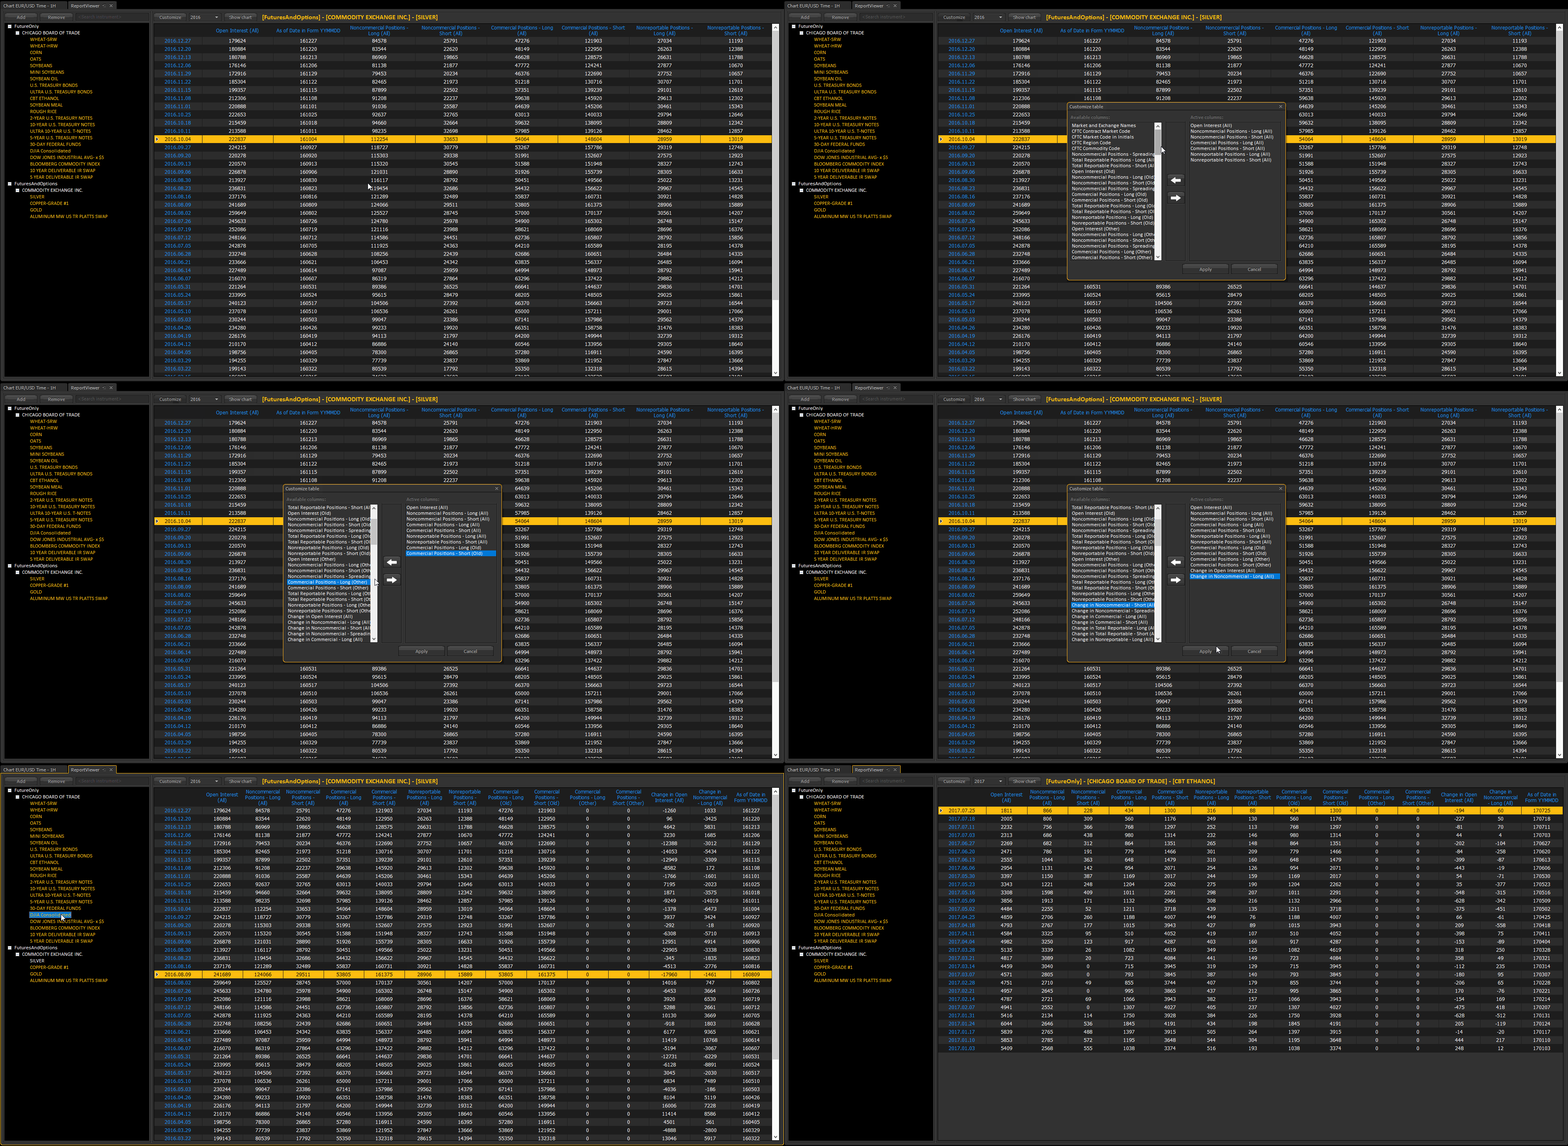
The “Legacy” report contains different information with more than 100 columns. You can select them by using “Customize” button (which will appear after selecting the instrument). After clicking “Сustomize table” window will appear and show the list of all available and active columns. “Active columns” is the list of columns which are currently displaying on the table. By using “Left” or “Right” arrows you can customize the table according to your preferences.
Graphic mode:
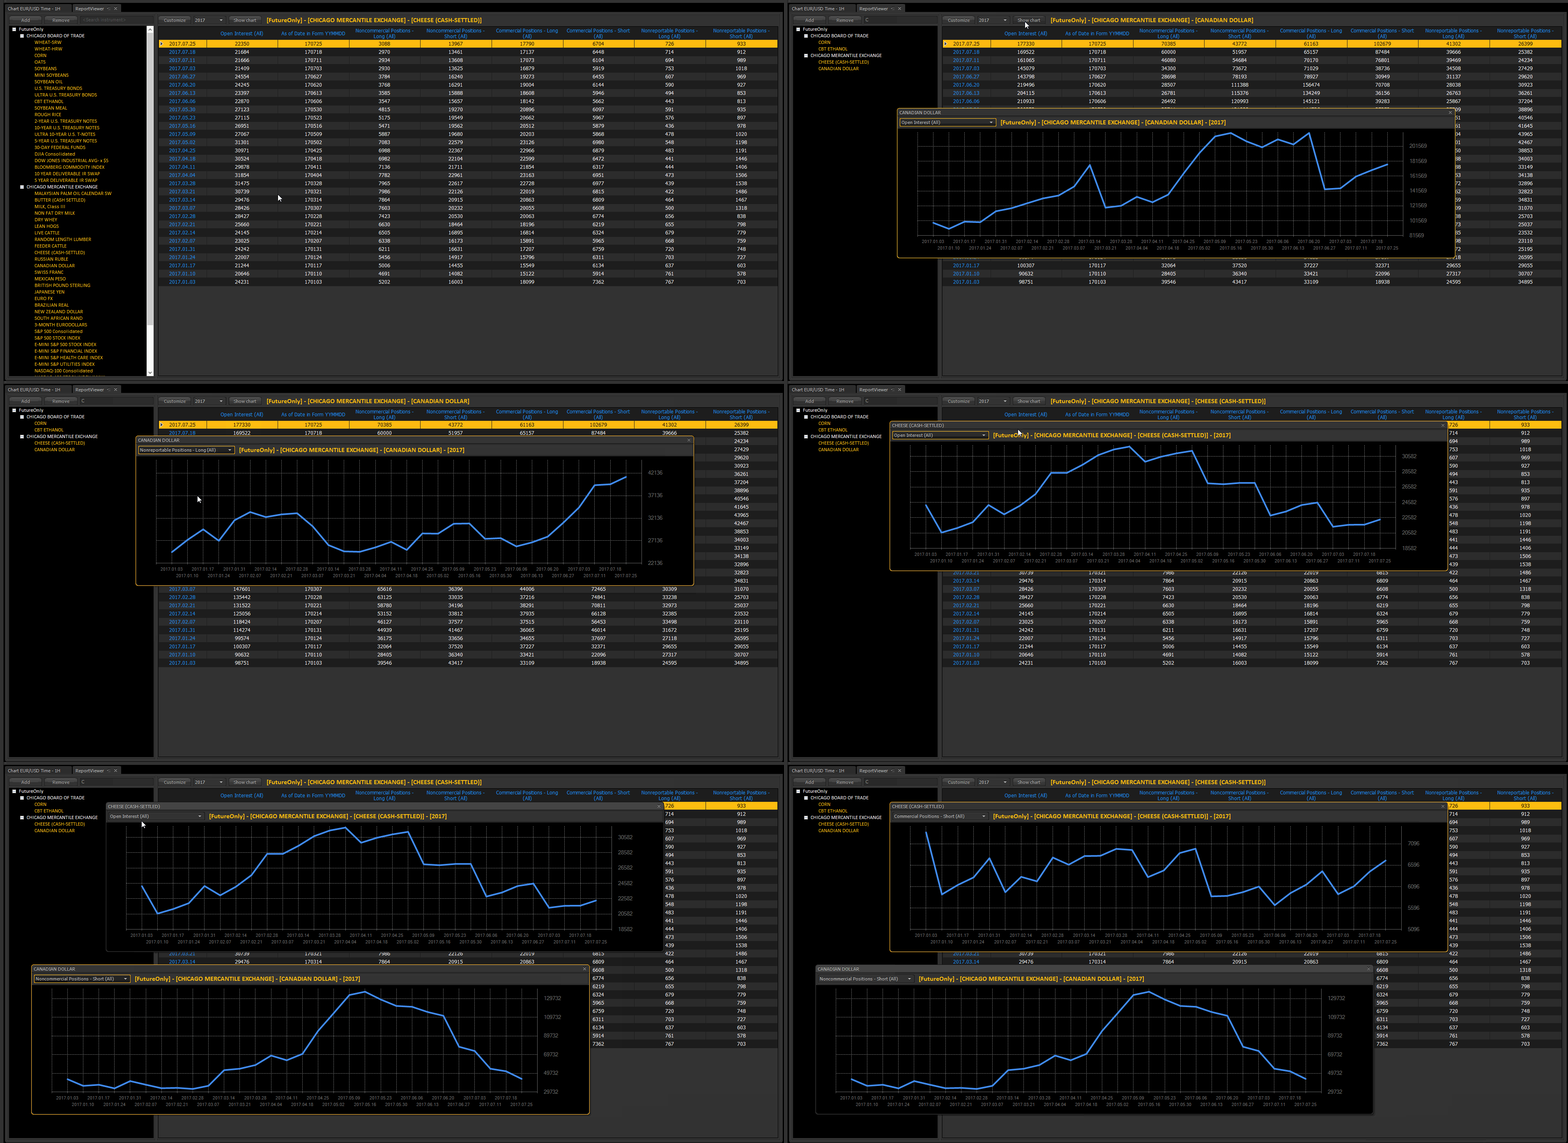
The ReportViewer can visualize any data from the table as a chart. To do this you need to select an instrument, add columns and click “Show chart” button. The new window will appear and display the selected column as a chart. If you need chart with other data (column), you can change it by using the drop-down list in the upper left corner of a chart window. The chart will be automatically updated with the selected data.
Updating reports:
The process of checking and updating of new reports is automatic when you launch plug-in.
Saving:
After saving a workspace, the ReportViewer will save own state too.
 10.08.2017
 107
107


