

How to trade with Turbo Renko chart
Last time we discussed about Renko charts in general. Today we want to look on how we can trade with them. Please keep in mind, that this is just my personal style of trading and should not be seen as a strict method or strategy. It should just act as a source of inspiration to develop your own trading style and show you the fascinating sides of Renko charts and the combination of tools to get you started.

Turbo Renko - the main trading tool
In this article, we will use Turbo Renkos also known as Flip Renkos (Geometrical Renko with 100% of inversion). We will use this type of Renko because it offers some good tradeoff between smoothing out the chart and whipsaws.
We will not use any fancy indicators volume tools, as they are not necessary, but you are completely free to use whatever adds value to your trading.
I suggest to not view more than 200 bricks on your screen, as looking to much left looking to much left to the past will only get you confused and hinders yourself from executing straight decisions.
Selecting the most efficient currency pair
When choosing a good currency pair, we need to look at two important parameters:- The amount of margin we have to pay for the financing
- The pip-value of the currency
By dividing those, we get the margin value per pip. The lower the value, the more efficient the margin will be in relation to the pip-value. This means, we can choose the currency with the highest Risk/Reward.means, we can choose the currency with the highest Risk/Reward.
The used leverage used will be 1:100. This will give us a good tradeoff between margin requirements and over-leveraging. The amount of leverage can of course be chosen by personal preference and risk, but as a rough guideline, it should be in the range of tradeoff between margin requirements and over-leveraging. The amount of leverage can of course be chosen by personal preference and risk, but as a rough guideline, it should be in the range of 1:10 to 1:100.
Without further ado, let's look at the major currency pairs (most popular first). You are free to choose a broker of your liking, but I'm preferring a commission- based ECN/STP broker, as it will give you very tight spreads and is more cost- efficient in the long run.
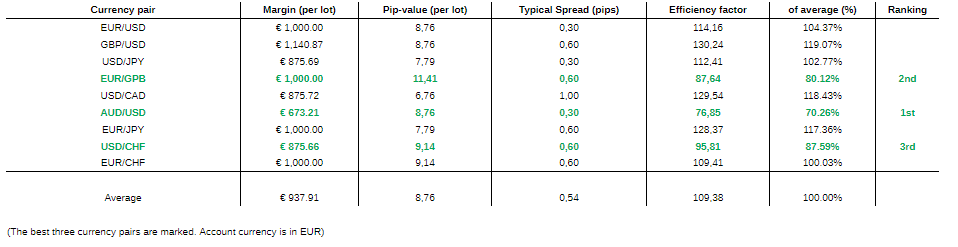
Selection of the optimal currency pair depending on the margin and pip value
Determining chart formations and signals
There are many methods and indicators to identify the prevailing trend. You will may According to the Table 1, AUD/USD gives us the best Risk/Reward at about 70,26 % of the average, while GBP/USD being the worst with 119,07 % of the average. The more percentage below average, the better Risk/Reward the currency pair offers, which will lead us to select AUD/USD for our trading.
Notice, that we will not use any or very limited amount of lagging indicators. This is because of their lagging and redrawing properties, which I don't like, but you are free to use anything, which adds value to your trading.
The basic properties of trend are determined by the highs and lows of price a movement. By looking at the highs and the lows of the bricks, we can easily tell, if there is an up- or a downtrend. This method can also be used for determining sub- trends and a trend change.
How to calculate a good Brick-Size?
We calculate our Renko brick-size by the following: the ATR of 1440 hour candles, which are roughly three months of market data: 1440 hours / 24 hours per day = 60 days; about three months of market data). This will be a reasonable amount of data for our brick size.
There is also the option to use other calculation methods like the ATR of 1440 minute candles, which is 24 hours of market data, or the ATR of 7200 minute candles, which is five days of market data. Some Renko traders are using a dynamic ATR of 14, but I prefer a static brick size, as it does not force you to update the charts because of the change of the ATR over time. Just use what fits your trading style.
Additionally, the brick-size should be five to ten times our spread. When using Geometric Renko, the brick-size should also be multiple of eight, as the extension value will be 12,5%: 100% / 12,5% = 8. We will stick to the ATR of 1440 hour candles for the rest of this article.
Let's calculate the values for our chosen currency pair of AUD/USD as seen in Figure 1.
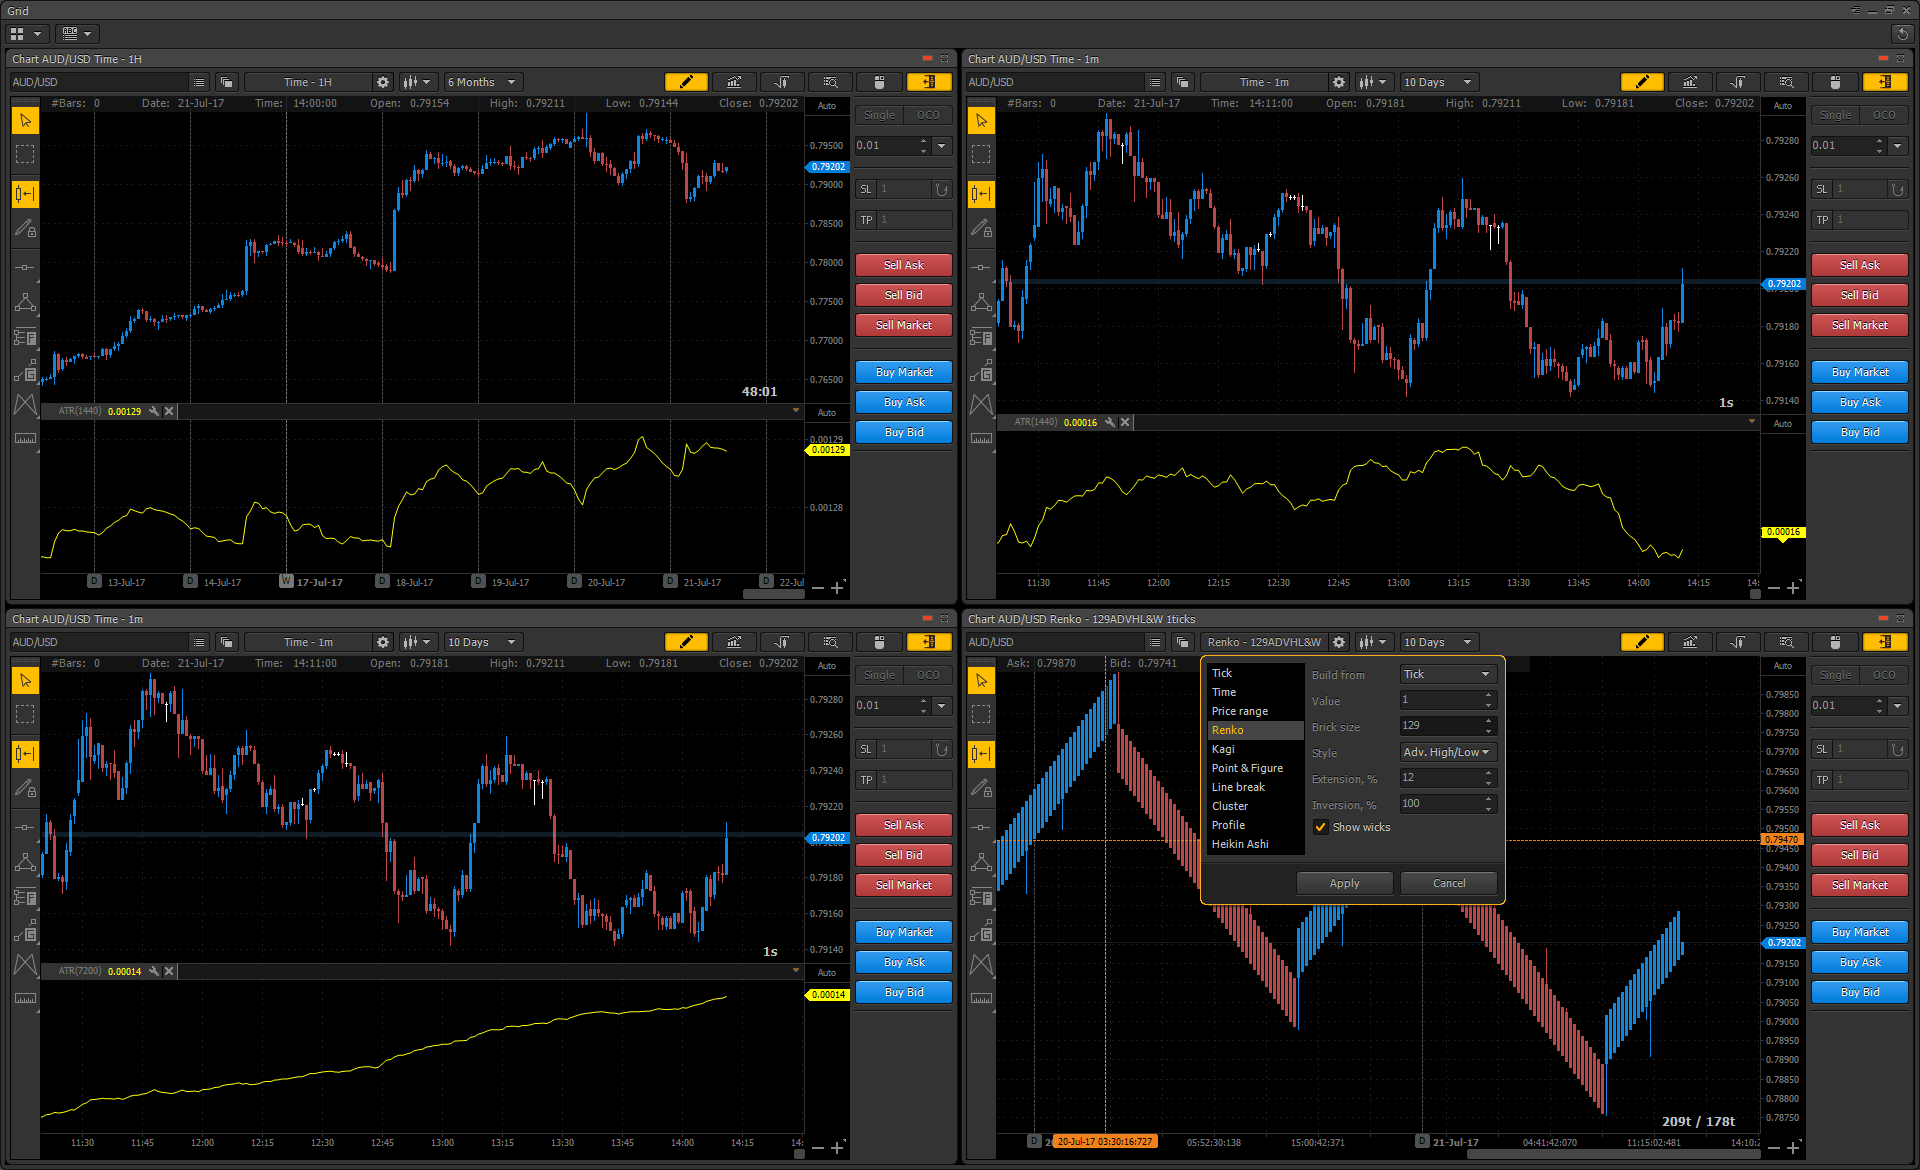
Figure 1: Selection of Brick-size parameter depending on the ATR
Important parameters while trading Renkos
Risk per trade
As a rule of thumb, you should only risk 1-2% of your Equity. For very small accounts, like 1000 EUR or below, a risk of 5% is manageable. You can of course risk even more, but it's very hard to come back again from a massive drawdown. I also hardly argue against using fixed cash stops, as the market and so your stops have to be flexible. A fix money stop will also harm your reward, as the risk/reward ratio will not change, depending on your Equity.
Minimum Reward to Risk ratio a trade should have
You should take trades, which offer you at least a risk/reward ratio of 0.5, which is a reward/risk of 2.0, as some traders use the notation of reward/risk instead of risk/reward. A risk/reward of 1 is ok, but it will not generate enough money in the long term and you also have to take much more trades, which can be a psychological problem for some traders.
Stop loss to limit the risk
First, you should always use stops. A nice method to calculate a good stop, is by taking the maximum of an ATR(34) or ATR(55) and an ATR(200). When using Renko charts, each brick-size will be the same, so the ATR will always be the same, no matter which period. Depending, if you are a aggressive or conservative trader, I recommend a stop of at least one brick (1 x ATR) or between one and a half and two bricks (1.5 ATR - 2.0 x ATR). Your stop should also be above/below a significant high/low.
The stop loss will be trailed down above/below the 2nd previous HH/LL, when a new HH/LL has been formed. If there is a long streak of bricks, e.g. ten bricks in one direction, the stop is moved to about the half of the streak. It's important, that we give the price room to breath. Under any circumstances, do not widen your stops! If your stop loss is triggered, your trading idea was wrong in the first place.
Potential targets for a trade
As mentioned earlier, you should take trades with at reward/risk ratio of two. If you are a trader, who wants to book in profits very early, scalp or accept a reward/risk below one, there are of course some options like suggested below. Trading Style | Percentage of Risk | Reward/Risk Conservative | 100% | 1 Moderate | 75% | 0.75 Aggressive | 50% | 0.5 Very Aggressive | 25% | 0.25
How are Reversals formed?
Before we can talk about what a reversal is and to understand various formations and signals, we first we need some definitions.
Definitions used in the chart
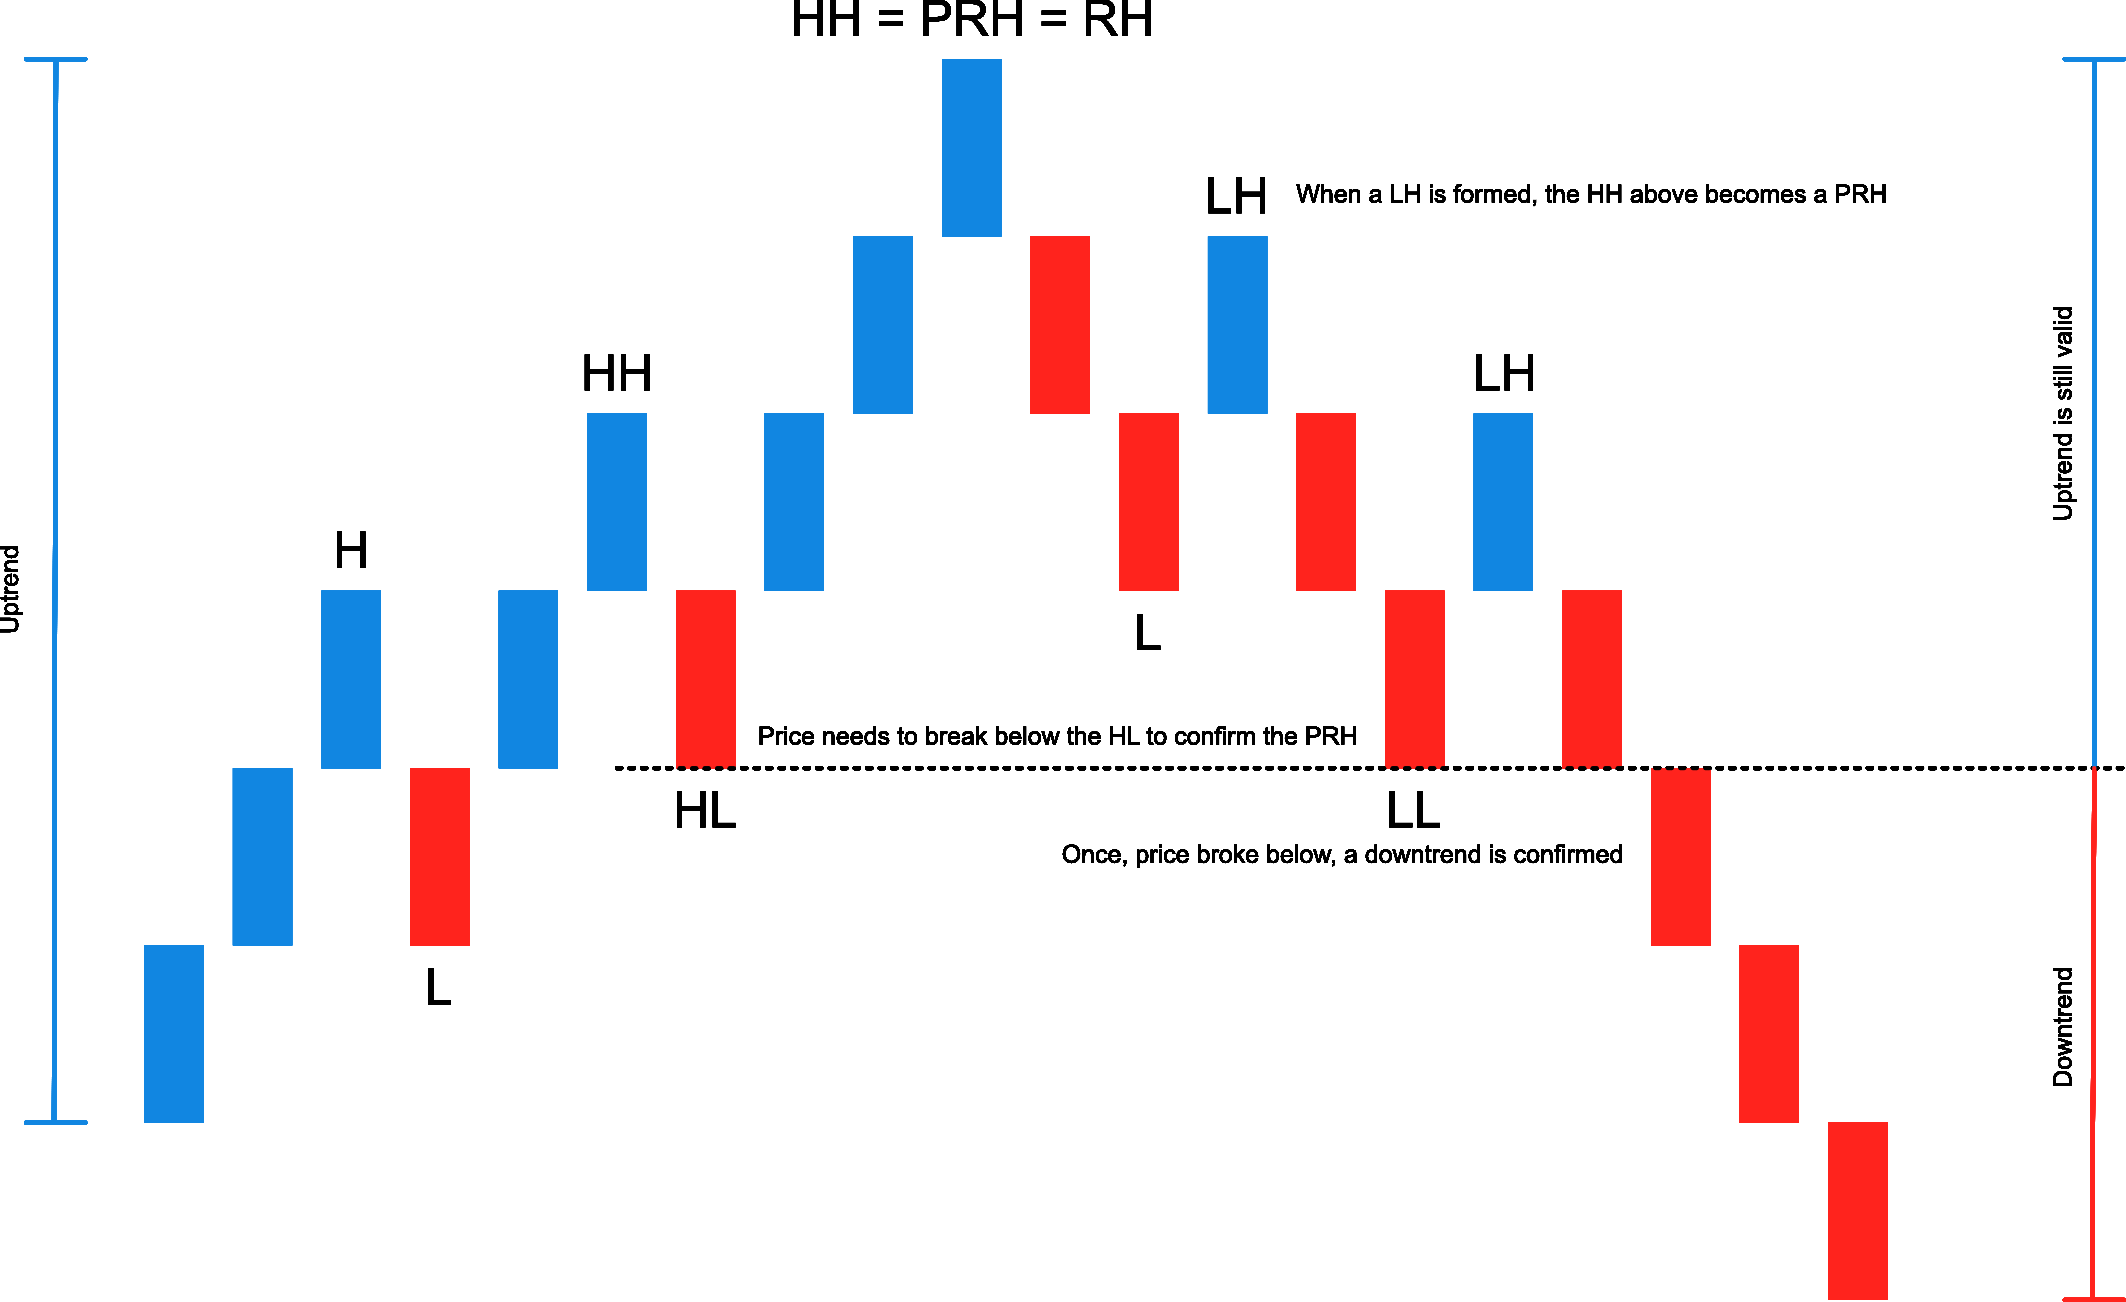
- Up-Trend (UT): higher highs (HH) and higher lows (HL)
- Up-Trend (DT) : lower highs (LH) and lower lows (LL)
- Confirmed High (CH): when a LL breaks a previous HL
- Confirmed Low (CL): when a HH breaks a previous LH
- Reversal High (RH): when a CH was formed
- Reversal High (RL): when a CL was formed
See Figure 2a and 2b for a visual representation.
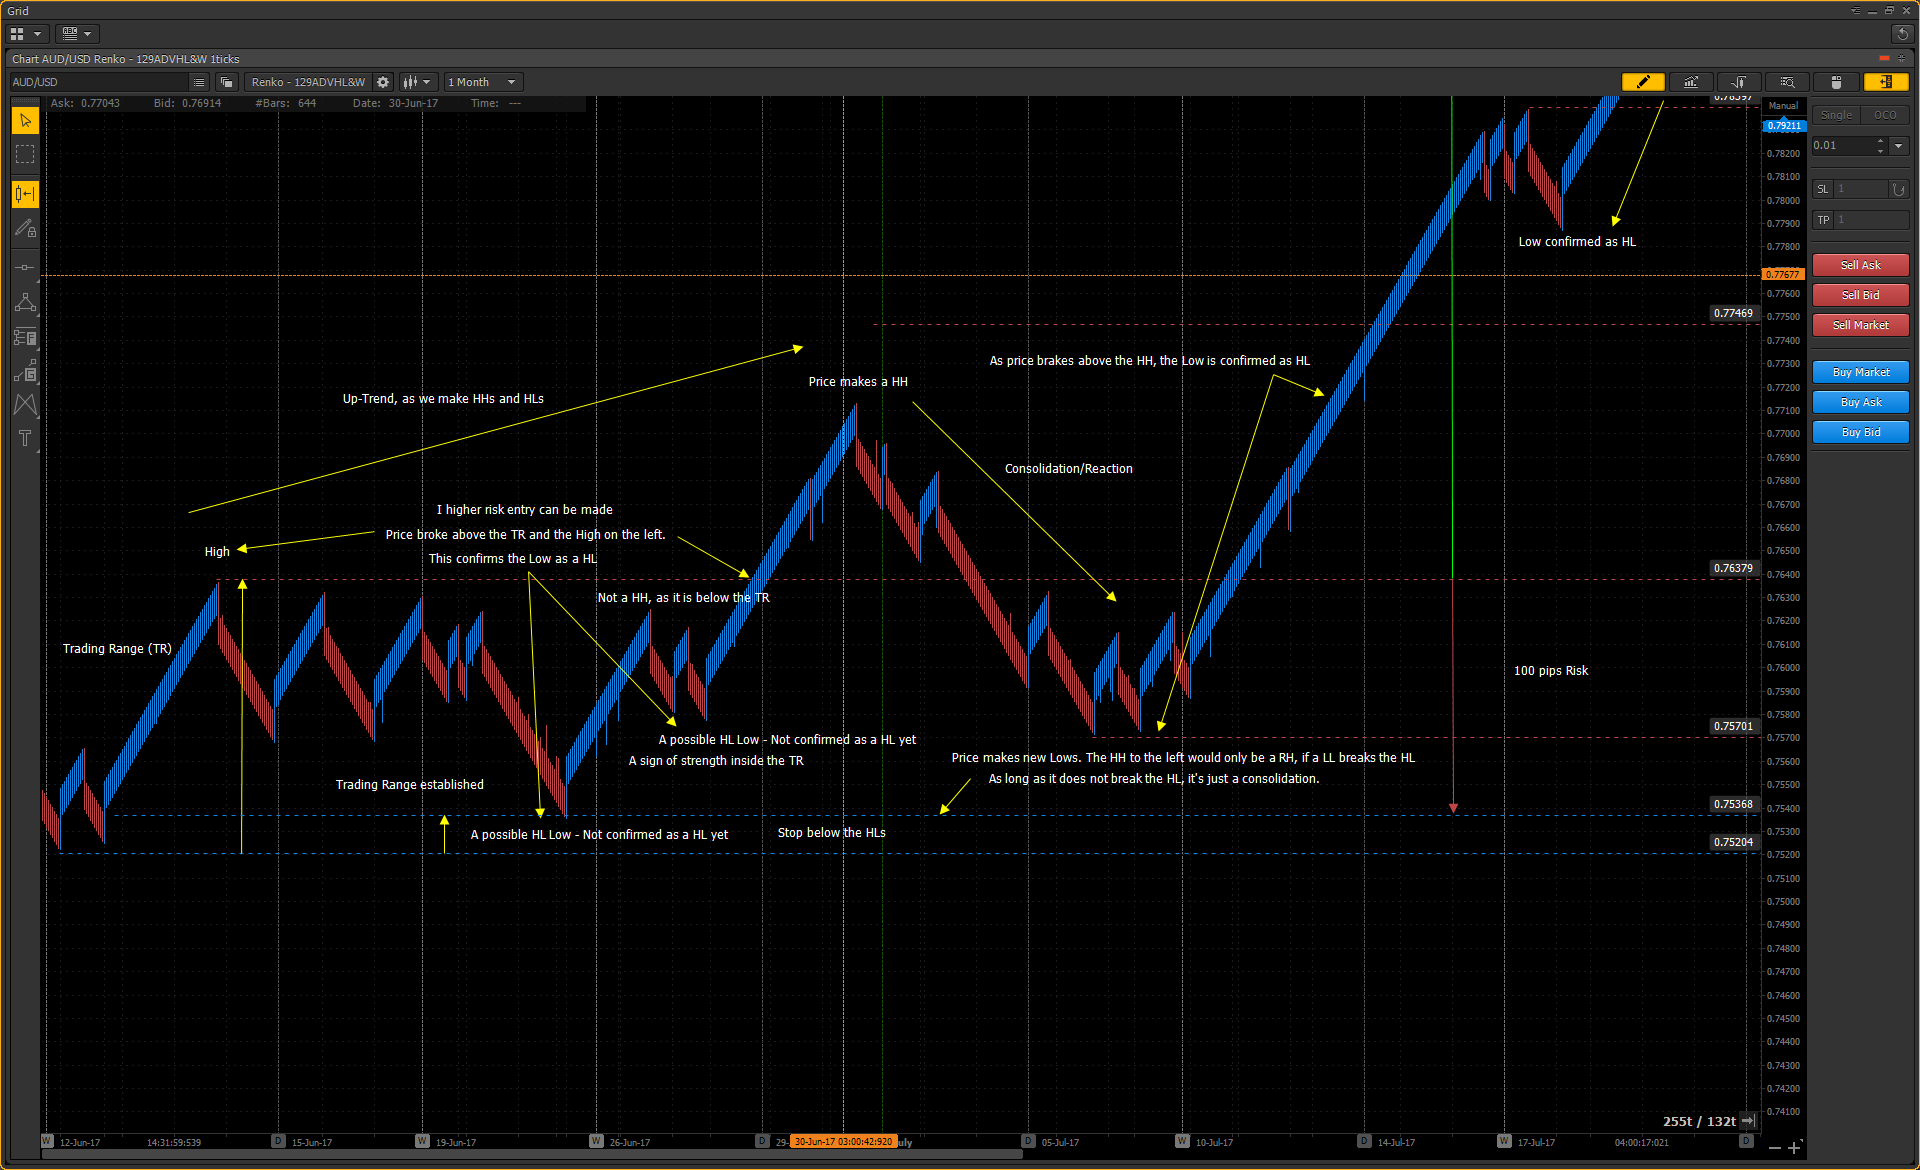
Figure 2a: Reversal formations on Turbo Renko chart

Figure 2b: Reversal formations on Turbo Renko chart
LL/LH/HH/HL formations, which are consisting of only three bricks, should be considered noise.
There are four properties we look at:
- An up-trend is prevailing, when the bricks are forming HHs and HLs.
- A down-trend is prevailing, when the bricks are forming LHs and LLs.
- A prevailing up-trend is only broken, if a RH is formed. A RH is only formed, if price breaks below a previous HL of a major pivot and forms a new L or a new LL.
- A prevailing down-trend is only broken, if a RL is formed. A RL is only formed, if price breaks above a previous LH and forms a new H or a new HH.
How to enter, exit and manage a trade
Entering and exiting a trade is just similar events but in the counter-direction.
- We enter a trade when a new HH/LL or an RH/RL has been formed.
- We exit a trade when a contrary reversal has been formed.
As the exit on a contrary reversal can cost a very large amount of pips, it should only be used as a last resort exit. The stop should always be trailed like mentioned in the Stops section and targets taken. There is also the possibility to scale-in and scale-out of a trade at easy to spot market structures. E.g. a scale-in can be executed, when a new LL/HH was broken within the prevailing trend and a scale-out can be executed, when LH/HL was broken within the prevailing trend.
Just keep in mind, that there will be losses, but also trade opportunities with a reward/risk of five and beyond.
The importance of Market Structure
Stops should always be set below/above important market structure. These structures are very easy to spot. E.g. double bottoms and double tops.
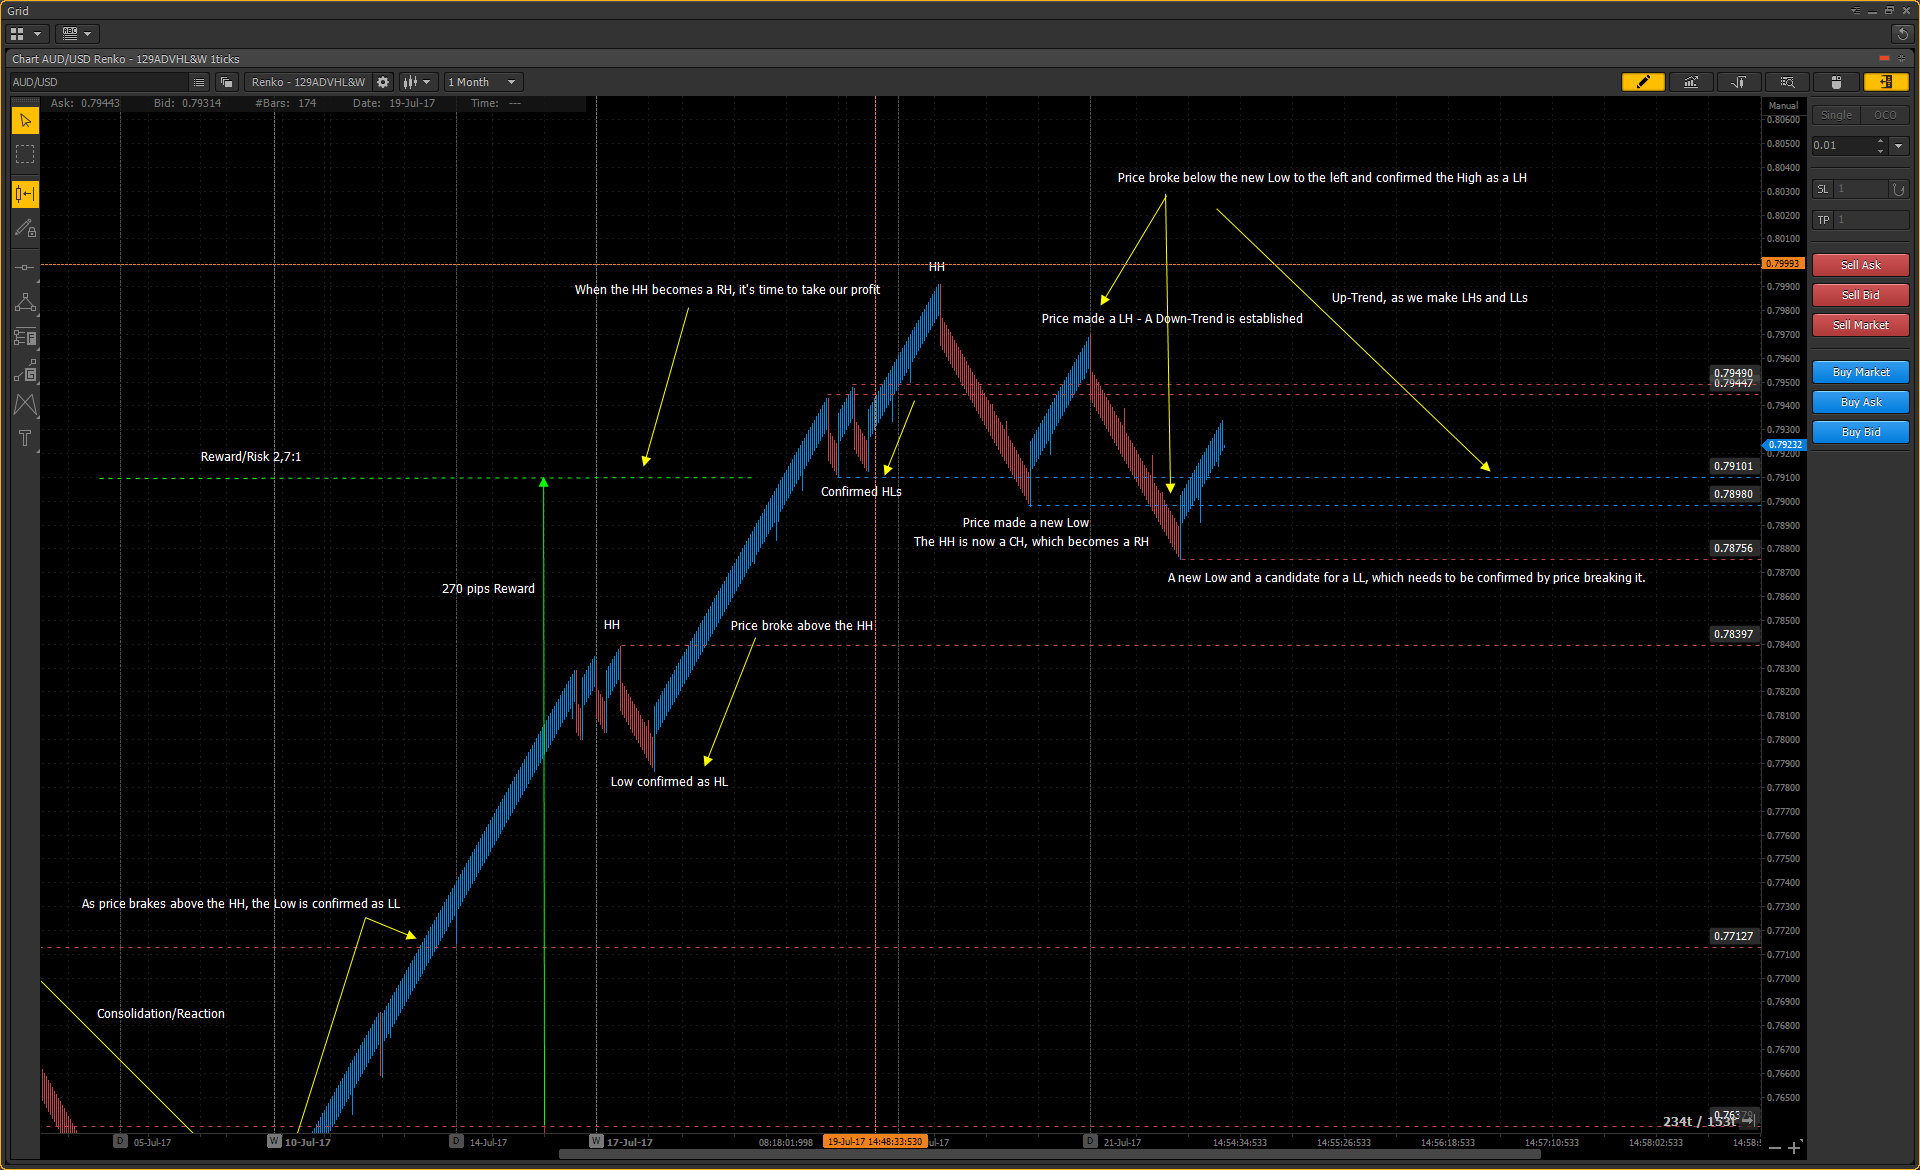
A real trading example on AUD/USD
So let the real fun begin. We will look into possible trades with stops, trailing stops and targets. The same trades will be marked on the various Renko types, so the visual differences between them can be seen and how each of them is canceling out the noise within their special properties.
Conclusion, why Renko charts add value to trading
Renko charts are easier to trade, as chart formations needed for various trading signals are easy to spot. The constant brick size acts as anchor points for stops and targets, which are easily countable as well. Less whipsaws and noise offer the ability to concentrate on entries and exits, without clouding the view on the chart.
In the next article, we add some leading indicator to our arsenal, which shows us future price projections and high probability trades.
Have not tried PTMC yet? There is no better way to boost knowledge than to use it! Start trading with PTMC now!

