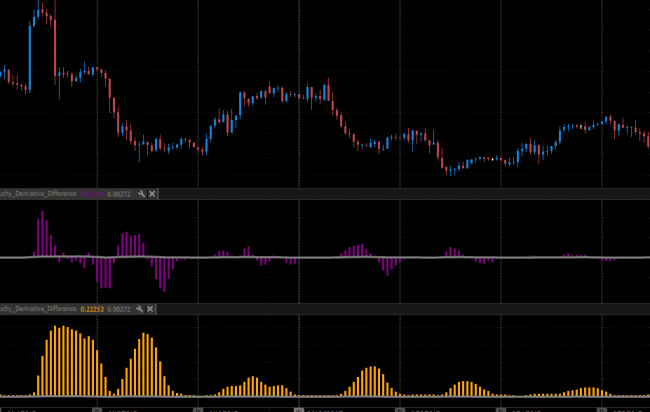
Cauchy Derivative and Difference Indicator
This tool serves to show the difference in the mean-arithmetic and average-geometric prices and also the deviation between those values of last and previous bars. Moreover it was powered by Standart Deviation (SD) algorithm to provide a better grasp on how to trade within kickbacks. Just hold your breath and wait up to the next market impulse which will be displayed by deviation tool then enter to the respect of price movement after a histogramm bar is descending, then hold this position up to second crossover with SD line. With difference tool it is possible to trace a power of impulses and trade during their accurance. That is it, both works fine as long trader perform reading their signals.
 06.07.2017
 51
51


