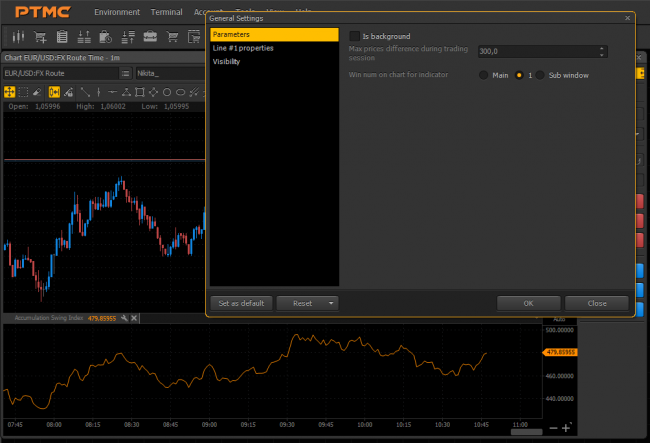
ASI Indicator
ASI provides support and resistance analysis because it has similarity with a line of actual prices which helps in looking up for deviations, breakouts, and new highs and lows.
Accumulation Swing Index (ASI) Indicator was invented by Welles Wilder. It can implement the real market state in a line, as an oscillation of previous minimum prices and maximum prices. Deeper, it determines the evaluation parameters of price changing, the pivots of short-term changing and an ability to see the trend and real power of the market.
ASI provides support and resistance analysis because it has similarity with line of actual prices which helps in looking up for deviations, breakouts, and new highs and lows.Files
 06.01.2017
 34
34
Discussion
Join PTMC community to post your comments
No comments yet. Be the first.


