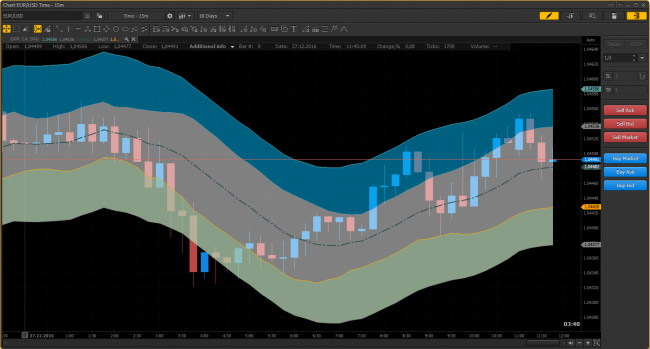
Envelopes ATR indicator
Envelopes ATR is a technical indicator which displays upper and lower deviation bands of price from MA. It is calculating based on the average volatility of the instrument on the indicator ATR.
The middle band (default white) is deviation band of price from MA. Upper and lower bands (default blue and green) are deviation bands of ATR values from MA. Signal to sell appears when the price reaches the upper line of middle band and a buy signal appears at the lower line.
Based on Nikolay Kositsin’smql5 interpretation Smoothing parameter varies in the meaning depending on algorithm:
- JMA has Phase gap -100/+100
- T3 Phase is multiplied by 100 for better visualization
- Phase for VIDYA is s CMO period Phase for AMA is a slow EMA period
Files
 27.12.2016
 70
70
Discussion
Join PTMC community to post your comments
No comments yet. Be the first.


