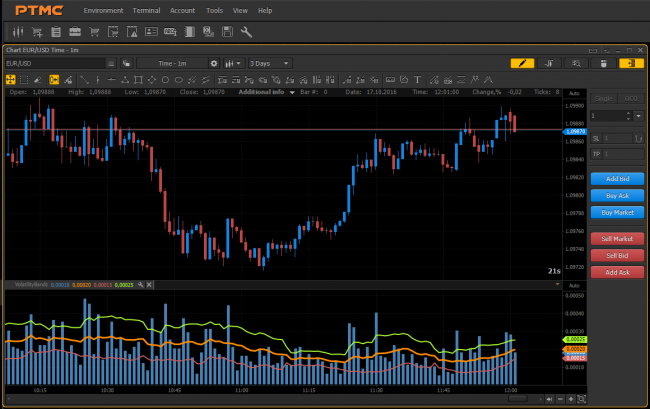
Volatility Bands indicator
In general, Volatility is a magnitude of price deviation over time. In other words - an amount (in points or percentage) which extends price for 1 min (1 hour, 1 day), etc.
Volatility is essential for practical trading, more specifically:
- select the most promising (moveable) currency pair to trade
- filter out market noise
- smart calculate the Stop Loss and Take Profits
Lines explanation:
Blue histogram - candles amplitude
Orange - moving averages line for predefined period
Green&Red - channel, which based on previous line with configurable standard deviation.
Remember, volatility is very important while choosing a trading instrument and the time frame for trading. Good luck!
 17.10.2016
 63
63


